![]()
As Rhode Island School of Design’s (RISD) 18th president, Crystal Williams believes that education, art and design, and staying committed to equity and justice are essential to transforming our society. At RISD, the Detroit-born activist is working to drive meaningful change centered on expanding inclusion, equity, and access. To back that up, Crystal has more than two decades of higher education experience as a professor of English as well as serving in roles that oversaw diversity, equity, and inclusion at Boston University, Bates College, and Reed College. The ultimate goal behind Crystal’s role at RISD is to enhance the learning environment by making sure it includes diverse experiences, viewpoints, and talents.
Photo: Jo Sittenfeld
However, Crystal’s talents go beyond the halls and classrooms of colleges and universities – she’s also an award-winning poet and essayist. So far, she’s published four collections of poems and is the recipient of several artistic fellowships, grants, and honors. Most recently Detroit as Barn, was named as a finalist for the National Poetry Series, Cleveland State Open Book Prize, and the Maine Book Award. Crystal’s third collection, Troubled Tongues, was awarded the 2009 Naomi Long Madgett Poetry Prize and was a finalist for the 2009 Oregon Book Award, the Idaho Poetry Prize, and the Crab Orchard Poetry Prize. Her first two books were Kin and Lunatic, published in 2000 and 2002. Crystal’s work regularly appears in leading journals and magazines nationwide.
Today, Crystal Williams is joining us for Friday Five!
Martha’s Vineyard \\\ Photo: Crystal Williams
Originally, I was going to write about a place that inspires me. But when I truly started to consider places I find inspiring, I realized that each of them elicits and enables silence and stillness, a refraction of silence (at least for me). So then, silence itself is the thing that inspires me. Silence inspires me to delve and investigate and allows me to situate myself in wonder and awe – in the amplitude and magnitude of who and what and how we are as a species, to sometimes take issue with personal fears or traumas or worse – the behaviors that ultimately impede personal and spiritual growth or insight.
For me, silence is a great gift. Perhaps the greatest. It is a balm. Through it, I connect to the world not as Crystal Williams of this particular body but as a congregation of embodied energy and spirit. In this way, it is the catalyst through which all good art, poetry, ideas, and leadership emerge. So it is among the most inspirational things in my life – and among the most rare, given my life.
Photo: Crystal Williams
I admire many poems. But Lucille Clifton’s “won’t you celebrate with me” (which is how it is commonly known although Clifton did not, in “Book of Light” originally title the poem), is the one that inspires me the most. It is a poem that speaks to resilience, fortitude, bravery, imagination, hope, and it names what being a Black woman in the United States can and often does elicit.
“won’t you celebrate with me
what I have shaped into
a kind of life? i had no model.
born in babylon
both nonwhite and woman
….
…come celebrate
with me that everyday
something has tried to kill me
and has failed.”
Nancy Wilson, Carnegie Hall, 1987 \\\ Video still courtesy YouTube
There are moments in art when an artist transforms one thing into another, utterly broadening, deepening, and transmuting the original meaning. In this live version of “How Glad I Am,” her encore performance at the 1987 “Live at Carnegie Hall” performance, Wilson – a vocalist I listened to obsessively as a younger person – transforms a simple song between lovers into a rousing tribute from an artist to her audience. This performance is the most profoundly loving example I have witnessed of an artist speaking directly and forcefully to the mutuality between artists and audiences. And it’s become a kind of personal soundtrack when I’m walking through my life, especially my life as a poet and now as president. Often, when I’m among creatives, I hear Wilson’s gorgeous, gravely voice imploring: “you don’t know how glad I am [for you].”
RISD students \\\ Photo: Jo Sittenfeld
Listen, these young people at RISD and young creatives everywhere are our best-case scenario. They are our visionaries, if only we can amplify them, listen to them, and then get out of their way. They have all the love (and strategy and insight and knowledge) we need if we can help them wield it successfully. They have all the intelligence and ingenuity we need to help solve our challenges and advance what is good, right, and just among our species. Added to those attributes are other facts: they are funny and curious and eager to learn and gloriously unusual.
I watch them here at RISD in their multi-colored outfits, hair-dos, and platform shoes, giggling with each other in front of the snack machine or intensely applying their best thinking to each others’ work during critiques. I listen to them grappling with big ideas, considering, reconsidering, and redesigning our world as if on slant, eschewing the boxes into which we have crammed stale ideas that continue to guide our actions. And I watch them in their magnitude – in the more quotidian actions of their lives trudging up and down the severe hill outside with their humongous portfolios and unwieldy art projects, and think through it all, “Wow” and think “to be so young and so powerful and necessary” and think “thank God” and think “Thank you, young people, for saying yes to the impulse that brought you here.” Not only do they inspire me, they humble me and they – each one of them – feel like a balm, like hope incarnate.
Photo: Crystal Williams
My folks married in 1967 against all odds. They were of different ethnicities – he Black, she white. Different places – he from the Jim Crow South, she from Detroit, Michigan. Different eras – he born in 1907, she in 1936. Different careers – he a jazz musician and automotive foundry worker, she a public school teacher. And different educational backgrounds – he, we think, not a high school graduate, she a college graduate. And yet, they found each other over the keys of a piano and decided, against society’s cruel eye and hard palm, to love each other and to love me. I now understand the courage it took for all of that to be true, for them to make a way, for them to walk through the world in 1967 as a couple and with me as their child. That courage inspires me. Those decisions inspire me. They inspire me. Everyday. All day.
Kin by Crystal Williams, 2000 \\\ Williams utilizes memory and music as she lyrically weaves her way through American culture, pointing to the ways in which alienation, loss, and sensed “otherness” are corollaries of recent phenomena.
Lunatic: Poems by Crystal Williams, 2002 \\\ Williams confronts large-scale social and cultural events such as September 11, the death of Amadou Diallo, and the Chicago Race Riots in addition to exploring the often paralyzing terrain of loss, desire, and displacement. Among its most common themes is personal responsibility.
Troubled Tongues by Crystal Williams, 2009 \\\ In each of the three sections of this book is a prose poem meant to be read aloud in which a character, interacting with other characters, is named for a quality. They are Beauty, Happiness, and Patience.
Detroit as Barn: Poems by Crystal Williams, 2014
This post contains affiliate links, so if you make a purchase from an affiliate link, we earn a commission. Thanks for supporting Design Milk!
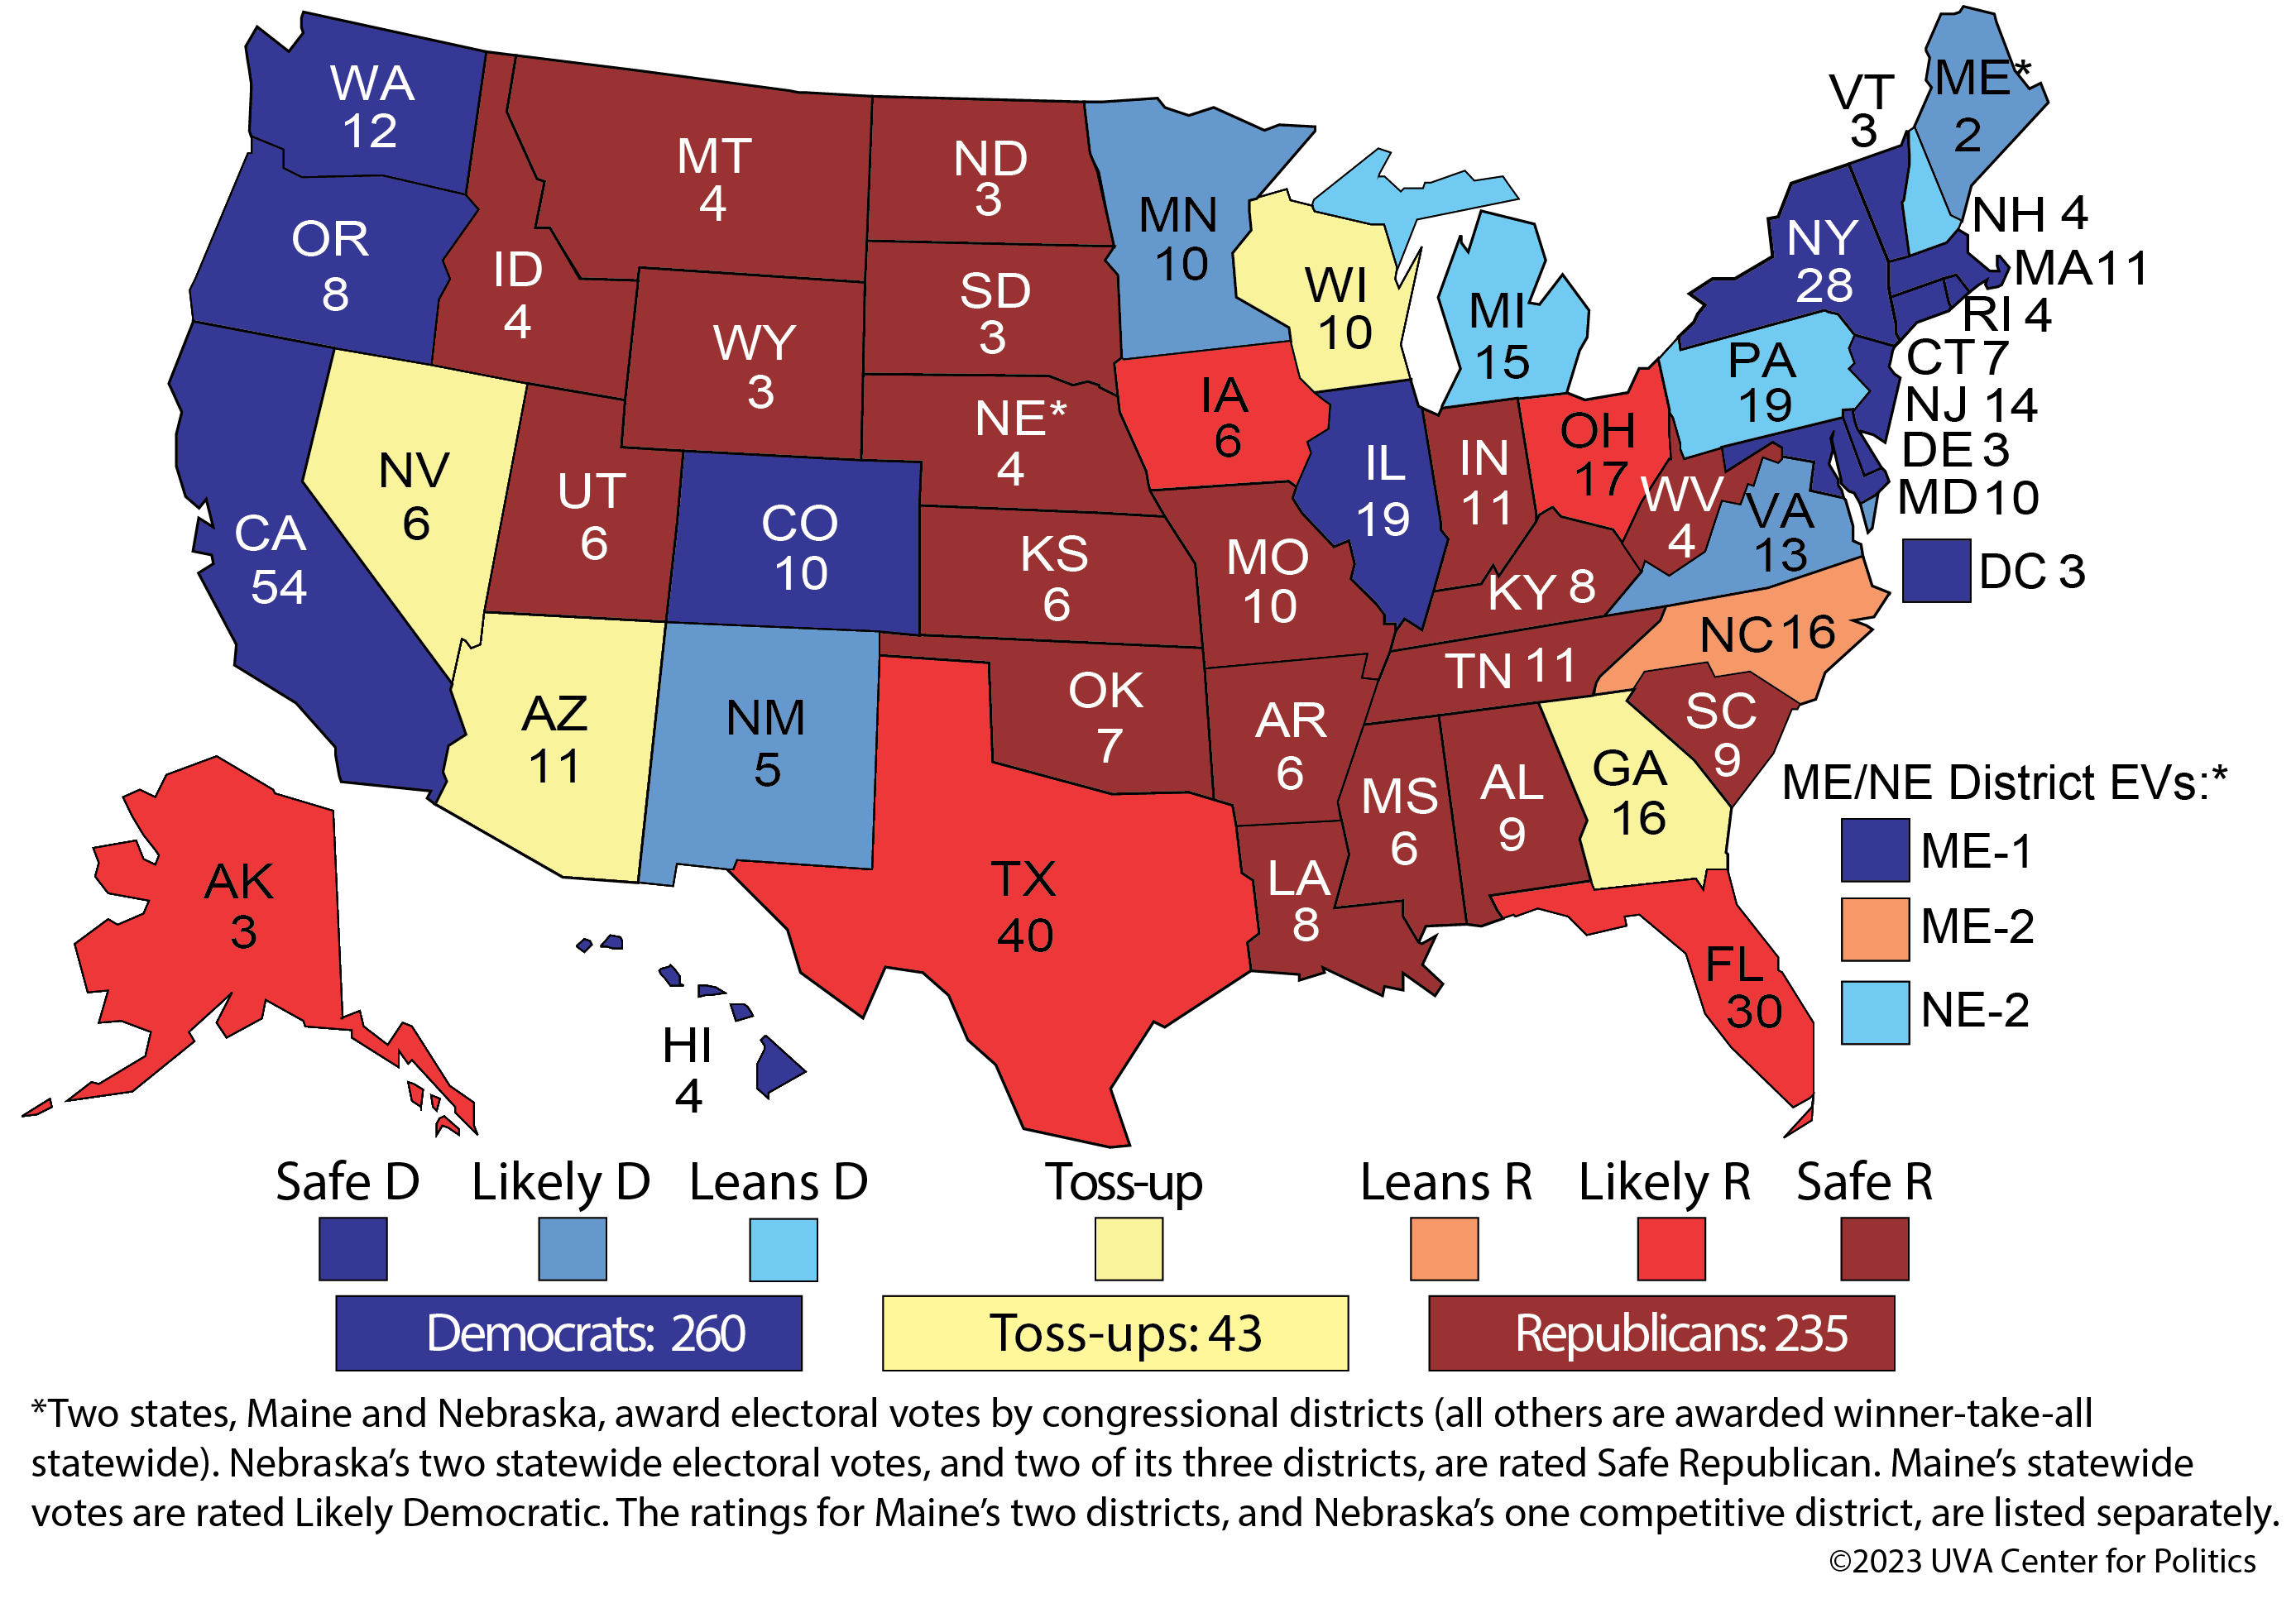
— Our initial 2024 Electoral College ratings start with just four Toss-up states.
— Democrats start with a small advantage, although both sides begin south of what they need to win.
— We consider a rematch of the 2020 election — Joe Biden versus Donald Trump — as the likeliest matchup, but not one that is set in stone.
Democrats start closer to the magic number of 270 electoral votes in our initial Electoral College ratings than Republicans. But with few truly competitive states and a relatively high floor for both parties, our best guess is yet another close and competitive presidential election next year — which, if it happened, would be the sixth such instance in seven elections (with 2008 as the only real outlier).
Map 1 shows these initial ratings. We are starting 260 electoral votes worth of states as at least leaning Democratic, and 235 as at least leaning Republican. The four Toss-ups are Arizona, Georgia, and Wisconsin — the three closest states in 2020 — along with Nevada, which has voted Democratic in each of the last four presidential elections but by closer margins each time (it is one of the few states where Joe Biden did worse than Hillary Clinton, albeit by less than a tenth of a percentage point). That is just 43 Toss-up electoral votes at the outset. Remember that because of a likely GOP advantage in the way an Electoral College tie would be broken in the U.S. House, a 269-269 tie or another scenario where no candidate won 270 electoral votes would very likely lead to a Republican president. So Democrats must get to 270 electoral votes while 269 would likely suffice for Republicans, and there are plausible tie scenarios in the Electoral College.
For the purposes of these ratings, we are considering a rematch of the 2020 election — Joe Biden versus Donald Trump — as the likeliest matchup, but not one that is set in stone.
Despite a multitude of weaknesses, such as an approval rating in just the low 40s and widespread concern about his age and ability to do the job, Biden does not have credible opposition within his own party, drawing only fringe challengers Robert F. Kennedy Jr. and Marianne Williamson. It may be that Biden could or should have drawn a stronger challenger, and maybe something happens that entices that kind of challenger into the race. But as of now, Biden appears to be on course to renomination.
Trump faces legitimate legal problems, specifically following his recent indictment over serious allegations that he improperly retained highly sensitive government documents. However, we would never presume an actual guilty verdict in this or another case until it actually happens — nor are we even sure a guilty verdict would prevent Trump’s renomination. It may be that the weight of Trump’s problems gradually reduces his level of support over the course of this calendar year leading into next year’s primaries, allowing a rival to consolidate the non-Trump portion of the party and really push him in the primaries. Or maybe Trump is compelled to take some sort of plea deal that involves him leaving the race. Those caveats aside, we see a party that is still broadly comfortable with Trump as its nominee. Until that changes, he’s the favorite.
It has now been more than a month since Trump’s leading GOP rival, Gov. Ron DeSantis (R-FL), entered the race. As best we can tell, he has gotten no real “bump” from becoming an official candidate — if anything, DeSantis’s polling position was stronger several months ago than it is today. Meanwhile, the field has gotten bigger, further splintering the non-Trump support while the former president remains as a clear plurality (or even majority) leader in national and state-level polling. This matters in a nominating contest in which even a plurality leader in a given state can end up getting the lion’s share or all of its delegates (as we saw with Trump in 2016).
For our general election outlook, we are not taking current polling much into account right now. Biden’s national polling right now is probably worse than what our ratings reflect: Different polls show either Biden ahead by a little or Trump ahead by a little nationally, and about a tie in aggregate per RealClearPolitics’s average. We believe Biden would do better than that, at least in the national popular vote, against Trump: Trump lost the popular vote twice, and we doubt he would be a stronger candidate in 2024 than he was in 2016 or 2020. The last time Trump was on the general election ballot was prior to the Jan. 6, 2021 storming of the Capitol, an event that can now be used effectively against him in a general election setting. We just saw that in the 2022 election, several candidates who were tied to Trump running in key states — such as Kari Lake and Blake Masters in Arizona, Herschel Walker in Georgia, several election-denying candidates in other statewide races across the nation, etc. — underperformed the electoral environment. Midterms are not presidential elections, and this does not necessarily mean Trump can’t win — he certainly could, and our ratings reflect that possibility. But the actual results from recent elections, which suggested significant problems for Trump, seem to be a better guide than off-year polling.
We also are not really taking third-party voting into account as of now, although one could imagine the third party vote, whatever size it is, hurting the Democratic nominee more than the GOP nominee. The Green Party nominee, who might be left-wing intellectual Cornel West, could hurt Biden from the left, while a potential candidate backed by the group No Labels could provide an outlet for moderate/conservative voters. However, we do think it’s likely that any third-party candidate will poll better than they perform, and that the ultimate third party vote does not seem likely to be large (perhaps bigger than 2020’s 2% of the total, but likely not reaching 2016’s 6%). Still, that may matter in a close race, so it is a very important factor to watch.
We have previously noted that Biden’s chances in the next election are very contingent on who the GOP decides to nominate as his opponent. As of right now, that person appears likeliest to be Donald Trump. That certainly doesn’t make Biden a shoo-in next year, but it does make him better positioned to win, which is reflected in our ratings.
Let’s take a look at some state-level details of our initial Electoral College ratings:
— Democrats start with 191 Safe electoral votes, while Republicans start with just 122. However, if you combine the Safe and Likely columns, the effective “floor” for both parties is essentially identical: 221 for Democrats, and 218 for Republicans. Texas is one of a handful of important states (Arizona and Georgia are a couple of others) that very clearly have trended Democratic in the Trump era. But Texas is still a Republican-leaning state, as its big urban areas have not quite gotten blue enough to make up for how red its lesser-populated places are. Other Likely Republican states Florida, Iowa, and Ohio have all moved right in the Trump era. Alaska also appears here as Likely Republican as its GOP lean has eroded in recent years, but it’s also still clearly in the GOP column, and it’s included here more as a curiosity than anything else.
— We suspect the rating that might spur the most disagreement is starting Pennsylvania as Leans Democratic, as opposed to a Toss-up. It’s also the one that, internally, we are the most conflicted about. On one hand, Pennsylvania only voted for Biden by a little over a point in 2020 after backing Trump by less than a point in 2016. That basic fact argues for Toss-up. But we also think Biden may have a bit more room to grow in vote-rich southeast Pennsylvania against Trump, which could help protect his narrow edge as Republicans try to squeeze even more of a margin out of the state’s white rural and small-town areas. Certainly Democrats did great in Pennsylvania in 2022, although we don’t necessarily view that as predictive — Democrats also did well in the 2018 statewide races, but that didn’t prevent the state from being close in 2020. If you believe we’re giving an unreasonable benefit of the doubt to Democrats in Pennsylvania, consider that we may be doing the same to Republicans in North Carolina, a state that was Trump’s closest victory in 2020. We also may be giving the GOP a benefit of the doubt by listing Nevada as a Toss-up instead of as Leans Democratic, given the Democrats’ frequent ability to pull out close victories in the state. But Democrats should be concerned that this working-class state’s center of votes, Clark County (Las Vegas), is getting more competitive as opposed to getting more Democratic.
— Arizona, Georgia, and Wisconsin seem like fairly clear-cut Toss-ups, given how close they were in 2020 (each was decided by less than a point). But there’s a world in which the realigning patterns we’ve seen in the Trump years, in which big metro areas like Phoenix and Atlanta are getting bluer, push their states (Arizona and Georgia) from a reddish shade of purple to a bluish shade, and that Pennsylvania ends up being closer for president than those states are. Who the GOP nominates will play a role here — maybe a non-Trump nominee ends up being a better fit for the party in the Sun Belt, which would solidify Arizona and Georgia as Toss-ups or maybe even push them back to the Republicans. Wisconsin, meanwhile, may be the purest Toss-up on the whole map: Its presidential margin was below a point in four of the last six elections.
— In our 2020 ratings — when we ultimately missed just one state, North Carolina — we started Michigan out as Leans Democratic, a decision that paid off, as Biden won the state by nearly 3 points after it surprisingly backed Trump in 2016. It remains Leans Democratic here, along with New Hampshire, which has long been considered a swing state but seems to have settled left of center. The GOP position on abortion, in particular, seems like a considerable problem in these states (one could apply this argument to Pennsylvania too, among other places).
— Maine and Nebraska, the two states that award electoral votes at the congressional-district level, have unique ratings. Nebraska’s two statewide electoral votes and two of its three districts are Safe Republican, but the Omaha-based NE-2 voted for Biden by about a half-dozen points in 2020, and we are rating it as Leans Democratic to start. Meanwhile, Maine’s northern 2nd District backed Trump by about a half-dozen points in 2020 and it starts as Leans Republican. The two statewide electoral votes are rated as Likely Democratic — Minnesota, New Mexico, and Virginia are also in that category — and the very Democratic 1st District of Maine starts as Safe Democratic.
We have previously noted that only seven states were decided by less than three points in 2020: Arizona, Georgia, Michigan, Nevada, North Carolina, Pennsylvania, and Wisconsin. This represents the real battlefield: Particularly if the race is a Biden vs. Trump redux, we would be surprised if any other state flipped from 2020 outside of this group.
Even then, we’re not even sure that all of these seven states are truly in doubt. After all, we’re starting three of the seven in the Leans category (Michigan, North Carolina, and Pennsylvania).
This all underscores the reality that despite the nation being locked in a highly competitive era of presidential elections, the lion’s share of the individual states are not competitive at all.
| Dear Readers: We’re pleased to welcome polling expert Natalie Jackson back to the Crystal Ball this week. She explores Donald Trump’s continued strength in the GOP despite a recent indictment. We also urge you to listen to our recent Politics is Everything podcast episode with Natalie, where we discussed Trump, the GOP’s polling requirements for entry into primary debates, and much more. Listen and subscribe here or wherever you get your podcasts.
— The Editors |
— Despite a second indictment, Donald Trump remains in a strong position in the GOP presidential primary field.
— Trump continues to earn majorities or near-majorities in polls, far outpacing his rivals, including Florida Gov. Ron DeSantis.
— Republicans would rather have a nominee they agree with than an electable one.
As the Republican presidential primary field fills out and former President Donald Trump confronts a second indictment, an intriguing battle of numbers has emerged among GOP pollsters aligned with Trump and Florida Gov. (and now candidate) Ron DeSantis over whether Trump can win a general election against President Joe Biden.
In a column for National Journal a couple of weeks ago, I discussed the team DeSantis argument and why leaked numbers that are favorable for Trump’s archrival are nothing to hang one’s hat on. The pollsters affiliated with DeSantis (or pro-DeSantis PACs) continue to push back on polls that look strong for Trump. In many cases their critiques are valid, but it’s unclear that a non-Trump Republican would overcome the hurdles they cite as problems for Trump.
Shortly after, team Trump has started pushing back by pointing out that the general electorate knows little about DeSantis, and demonstrating how they can make the DeSantis polling numbers look worse by saying bad things about him. That’s a common campaign message testing strategy that campaign pollsters use to figure out their opponents’ weaknesses — it’s just usually not made public. Like the pro-DeSantis leaked polls, however, this pro-Trump memo was leaked to make a specific point.
That was before Trump’s latest indictment, but the arraignment in Miami looks to change little in the GOP primary race. The particular Trump vs. DeSantis electability data war is likely to continue, as DeSantis has chosen to attack the Justice Department rather than Trump. Trump still maintains three significant advantages that DeSantis and the other candidates will have to climb a mountain to overcome:
It’s still early, but both FiveThirtyEight’s and RealClearPolitics’s polling averages show Trump currently above 50% in national primary polls, and solidly leading in early state polls. Only a few polls have emerged since the indictment, but there is not a clear sign of this changing. It’s still early (repetition intentional), but breaking the 50% threshold is substantial, particularly given that the remaining vote has to be divided among a lot of candidates and only DeSantis regularly gets into double digits. A CBS News-YouGov poll, partially conducted after the latest indictment news, shows 75% of likely Republican voters are considering voting for Trump, with the next contender (DeSantis) being considered by 52% — and from there it drops to a fifth or less. Even if Trump loses a few percentage points due to the indictment, the uphill climb for the challengers is steep with a lot of rock scrambling.
That same CBS News-YouGov poll shows that 62% of Republicans say Trump would definitely beat Biden in 2024. A recent Monmouth University Poll had a similar finding — that 63% of Republican voters think Trump is likely their best bet. These numbers could certainly change. That’s true of any numbers in this column — that’s why I keep saying it’s still early. But nearly two-thirds of the potential primary electorate thinks Trump is the one to beat Biden. That means most Republicans are not open to DeSantis’s argument that he’s more electable. If people aren’t open to an argument, it won’t be very effective.
A moderate Republican would have a smoother pathway to victory than Trump or DeSantis, particularly given Biden’s lackluster numbers, age, and relatively low-key persona. But moderate candidates face a very difficult primary environment where ideologues are more likely to vote for strong conservatives. A March CNN poll showed 59% of Republicans and Republican-leaning independents would choose a candidate they agree with on the issues over a candidate who has a strong chance to beat Biden (41%). This undoubtedly favors Trump over other candidates. Michael Tesler pointed out in FiveThirtyEight that Republicans now equate Trump support with conservatism. The CBS News-YouGov poll showed that Republicans split 50-50 on whether they should focus on appealing to moderates and independents vs. motivating conservatives and Republicans.
There are still two significant complicating factors for Trump, though. The first is obviously his ongoing legal risk, with now two indictments and additional investigations ongoing. However, these investigations don’t seem to affect Republicans’ views of him, although an ABC News-Ipsos poll conducted after the second indictment does show that 38% of Republicans think the charges are serious, compared to only 21% in the first indictment. That said, the same poll shows that 80% of Republicans think the new charges are politically motivated, and nothing prevents Trump from running while under indictment — or even from prison.
The other complication is that the GOP primary field is large. It remains possible that one of these alternatives could catch on with voters and dislodge some of Trump’s supporters. A large field challenging an ex-president (an incumbent once-removed?) seems odd if Trump is really the party leader.
Contrast that with 2020, when Trump faced no significant challenges. That said, the GOP would have to align behind one alternative by January or so in order to give that candidate any chance of winning the nomination. And even then, we have no idea whether Trump or DeSantis, or any other candidate, would win. You can say it the other way, too: We have no idea whether Biden will win. It’s too early and the numbers all show a close race, as I wrote a couple of weeks ago.
Still, the evidence we have now indicates that if the field remains Trump vs. nearly a dozen (or more) others, Utah Sen. Mitt Romney is correct: Trump is “by far” the most likely Republican presidential nominee in 2024. Electable or not.
| Natalie Jackson is a research consultant working in political polling and a contributing editor with National Journal. More of her writing can be found on her substack. |
![]()
Gov. Ron DeSantis of Florida at a bill-signing event this month.
![]()
“Fearless progress toward justice often meets ferocious pushback from the oldest and most sinister of forces,” President Biden told Howard University’s graduating class.
EJ Montini of USA Today suggests that Biden should channel his inner Gerald Ford and pardon Trump for the good of the nation. In his mind, pardoning someone who was impeached twice and has a number of criminal investigations dogging him is the epitome of national unity. — Read the rest
| Dear Readers: Join us on Tuesday, April 11 for a conversation with Nguyen Quoc Dzung, ambassador of Vietnam to the United States. The ambassador will speak on the relationship between Vietnam and the U.S. and issues impacting Vietnam and Southeast Asia.
The program begins at 6:30 p.m. eastern at Minor Hall, Room 125, on the Grounds of the University of Virginia. It is free and open to the public to attend with advanced registration through Eventbrite; it will also be livestreamed at https://livestream.com/tavco/ambassadorofvietnam. — The Editors |
— After looking at the Midwest last week, we’re comparing the presidential voting trajectory of the bigger counties versus the rest of the state in a number of eastern states.
— Georgia had exactly opposite top and bottom halves in 2020, with a very Republican (but stable) bottom half and Democratic-trending top half driven by changes in Atlanta.
— North Carolina and Pennsylvania are mirror images on opposite sides of the political divide.
— Florida’s turn toward the Republicans has been a bit more pronounced in its top half of bigger counties compared to its bottom half, making it an outlier among the states we’ve studied.
— South Carolina’s status as a red state is much more about its top half than its bottom half.
James Brown’s version of the song “Night Train” — one of the best songs ever recorded, in my humble opinion — calls out the path of a train starting from Miami and moving up the eastern seaboard. Among other places, the train stops in Atlanta, Raleigh, Richmond, and Philadelphia.
What does this have to do with presidential politics? Well… nothing really. It’s just that I heard the song over the weekend as I was trying to tie together the collection of eastern states I’m analyzing this week. This is a follow-up to last week’s exploration of how the biggest counties in a state vote for president compared to the rest of the state. So, I thought, the Night Train’s path kind of does the trick. Plus, if this apparent non sequitur inspires you to listen to the song, well, trust me, your day will be better off for it.
After analyzing 7 Midwestern states last week, we turn east this week, looking at a series of states extending from Pennsylvania in the north to Florida in the South. They are geographically connected, except that we skipped Maryland on account of it being so overwhelmingly Democratic.
These are a politically diverse group of states, including red South Carolina, bluish Virginia, reddening Florida, and 3 of the nation’s premier battlegrounds: Georgia, North Carolina, and Pennsylvania.
Just like last week, we split each state in half, grouping together the biggest-voting counties that added up to roughly half the statewide vote in the 2020 presidential election (the top half) and comparing them to the other counties that make up the rest of the state (the bottom half). We used Dave Leip’s Atlas of Presidential Elections for the results, and Dave’s Redistricting App to highlight the top half counties in orange on the maps that follow. For a more detailed explanation of methodology, see last week’s piece.
All aboard?
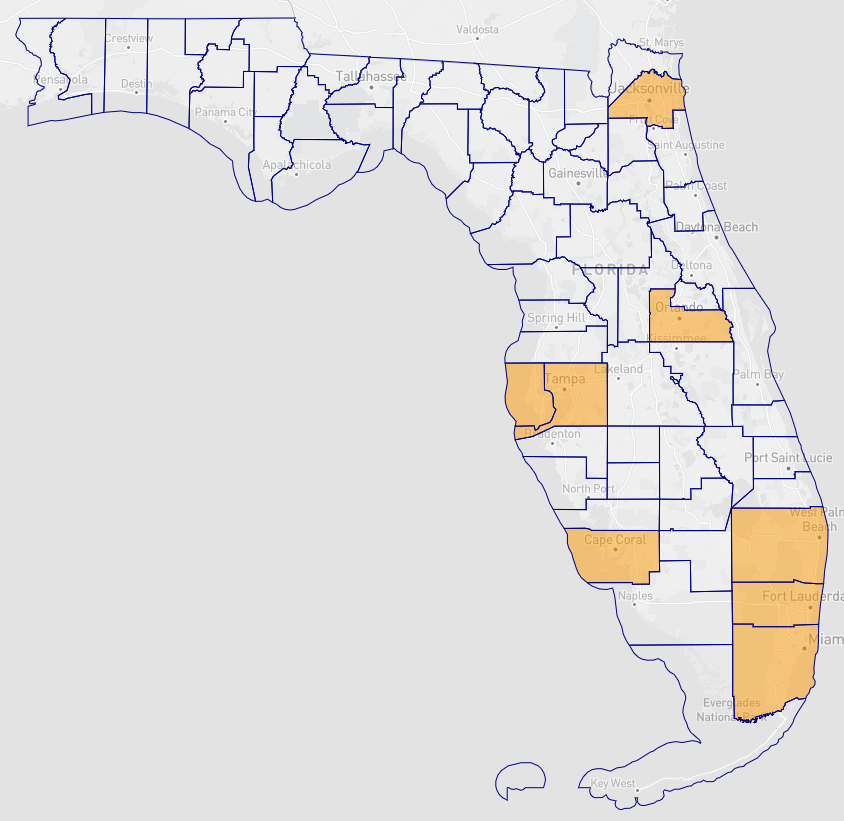
Top half counties that add up to half the statewide vote: Miami-Dade, Broward, and Palm Beach in South Florida cast about a quarter of the statewide vote. Others in this group are Hillsborough and Pinellas, which make up the core of the Tampa/St. Petersburg/Clearwater area; Duval (Jacksonville) in the northeast; Orange (Orlando) in central Florida; and Lee (Fort Myers/Cape Coral in the southwest). Joe Biden won all of these but Lee; Barack Obama won 6 of the 8, losing Duval and Lee.
Bottom half counties that make up the other half of the statewide vote: The state’s other 59 counties; Obama lost all but 7, Biden lost all but 5.
Of the 13 Midwestern/eastern states we’ve looked at as part of this analysis, Florida has an unusual distinction: It is the only 1 of the 13 where the Democrats’ margin in the top half dropped more than their margin in the bottom half from 2012 to 2020. As you can see in Table 1, the drop was similar — 4.4 points in margin in the top half and 3.9 in the bottom half — which makes it an outlier, too, as generally (not always) the bottom halves of these states have gotten substantially more Republican as the top halves have seen only a modest Democratic decline or, sometimes, a small or even large pro-Democratic shift.
A big reason for a Republican shift in the big counties is that the 3 big South Florida counties were considerably less blue in 2020 than they were in 2012: Obama won the trio by 26 points, while Biden won them by 16 points. Miami-Dade has driven that shift, going from a 24-point Obama margin (and 29 for Hillary Clinton in 2016) to just 7 for Biden in 2020, but the other 2 got less blue as well, albeit not as dramatically.
Overall, Florida has a bottom half that is comparable to some states in the Midwest, perhaps in part because Florida’s booming retirement communities (many of which have big populations but are included in the bottom half) have many Midwestern expats (we looked at some of these counties last year). Trump won Florida’s bottom half of counties by 18 points, very similar to Wisconsin (15 points) and Minnesota (17 points). But the top half of Florida only voted for Biden by 11 points, comparable to the top half of Iowa (12 points), a state that like Florida has shifted right recently. Florida is definitely more competitive than the double-digit victories by Gov. Ron DeSantis (R) and Sen. Marco Rubio (R) last year, but it’s also clearly trending toward Republicans.
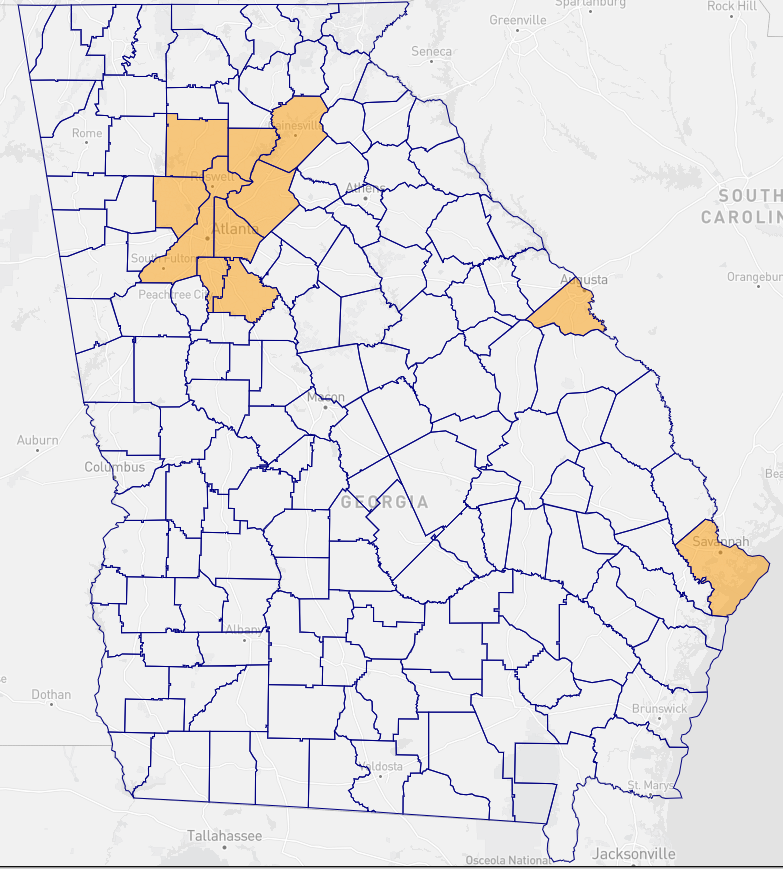
Top half: 11 counties, with 9 of those being part of the Greater Atlanta area (Fulton, Gwinnett, Cobb, DeKalb, Cherokee, Forsyth, Henry, Clayton, and Hall, in order of most to least populous). The other 2 counties outside of Atlanta’s orbit are Chatham (Savannah) in the southeast and Richmond (Augusta) in the east. Biden won 8 of these 11, with the exceptions being Atlanta exurbs Cherokee, Forsyth, and Hall. Obama won just 5 of the 11: Clayton, DeKalb, and Fulton in the Atlanta area in addition to Chatham and Richmond.
Bottom half: Georgia has a lot of counties, and 148 of the 159 make up the bottom half. Obama won 29 of these counties, while Biden won 22. Like many other Southern states, Georgia has a lot of rural and heavily Black Democratic counties, which helps account for Democrats’ ability to win these counties, although as their dwindling number suggests, many of these counties have still drifted towards Republicans.
The change in Georgia has been essentially entirely driven by its top half counties, which is dominated by counties in the Atlanta orbit. The Democratic presidential margin in Georgia’s top half has swelled from 10 points in 2012 to 26 points in 2020. Meanwhile, the bottom half has hardly changed at all, moving from a 25-point Republican margin to a 26-point margin. In Georgia, Republicans were effectively already maxed out with rural white voters prior to Trump, and there also are a substantial number of votes in the bottom half from majority Black rural counties and a few larger Democratic-leaning counties to keep Democrats from getting completely blown out in that group (the bottom halves of Iowa and Ohio, for instance, are redder now than the bottom half of Georgia). The bottom and the top halves gave their respective candidates 25.7-point margins — exactly the same, down to a tenth of a point. Biden won because the top half counties cast slightly more of the vote, based on this calculation (50.5% vs. 49.5% for the bottom half).
The bottom line is if Republicans can’t stop the bleeding in the Greater Atlanta area, Georgia eventually could go the way of Virginia and become bluer than the nation as opposed to redder (which it still is).
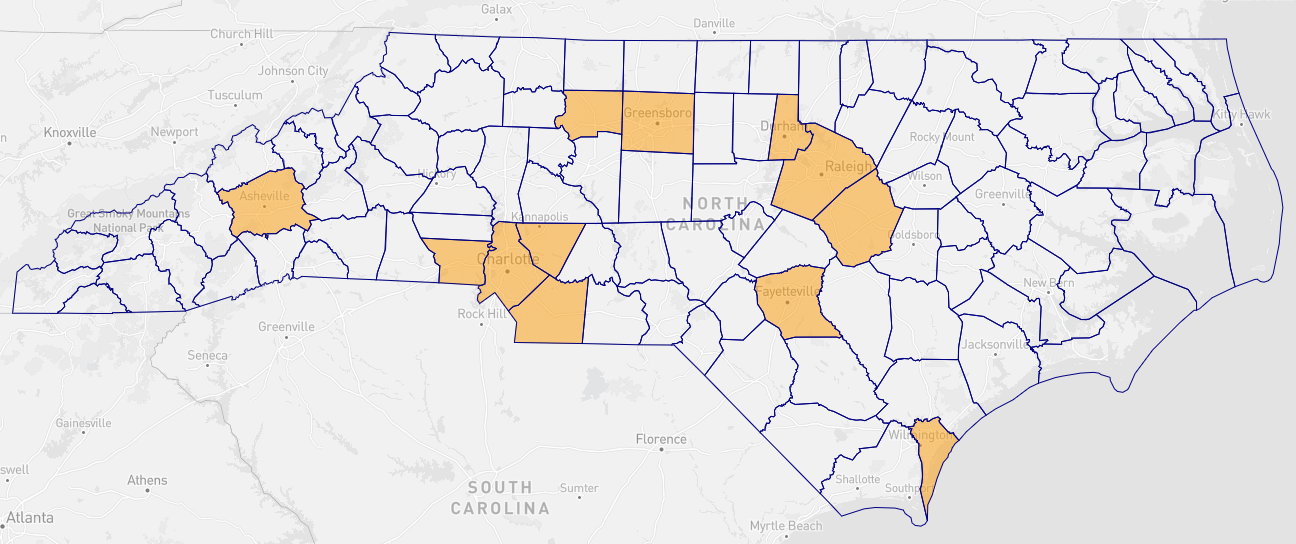
Top half: The dozen counties that make up North Carolina’s top half are generally centered around Raleigh-Durham, Charlotte, and the Piedmont Triad (Greensboro/High Point/Winston-Salem). The biggest source of votes is Wake (Raleigh), and neighboring Durham and Johnston counties are also in this group. Mecklenburg (Charlotte), the second-largest source of votes, is also included, along with neighboring Union, Cabarrus, and Gaston. Guilford (Greensboro) and Forsyth (Winston-Salem) cast the third and fourth-most votes, respectively, and are located west of the Raleigh-Durham metro area. Finally, Buncombe (Asheville), Cumberland (Fayetteville), and New Hanover (Wilmington) provide other vote anchors in, respectively, the western, south-central, and southeastern parts of the state. Biden won 8 of these 12 counties, losing only the suburban/exurban Johnston south of Raleigh as well as the suburban/exurban satellites of Mecklenburg: Cabarrus, Gaston, and Union. Obama won 7 of the 12, with the same lineup as Biden except Obama narrowly lost New Hanover while Biden won it.
Bottom half: The other 88 counties: Obama won 23, Biden won 17.
The Tar Heel State is in a period of considerable flux, with the gap between its top and bottom halves expanding. But for all of the positive Democratic trends in the top half, the bottom half has gotten considerably more Republican over the same time period, too, keeping the state persistently right of center.
At the topline level, North Carolina voted very similarly in 2012 and 2020, producing a 2-point margin for Mitt Romney and then a 1.3-point margin for Donald Trump. In each election, the state was the Republican nominee’s closest victory. Yet like other states, that statewide similarity masks a lot of changes happening at the sub-state level, with Democrats getting bigger margins in the major urban areas but losing ground elsewhere. Biden was the first postwar Democratic nominee to clear 60% of the vote in both Mecklenburg and Wake counties and still came up short, speaking to how much the rest of the state has moved. Two key places of Democratic slippage have come in the northeast, home to several heavily Black rural counties where Democratic performance is not as strong as it once was, as well as a mix of counties near the South Carolina border between Charlotte and Fayetteville. Robeson County, home of the Lumbee Indian tribe, is a prime example, as it went from 58%-41% Obama to 59%-41% Trump in just 8 years.
Two key differences between Georgia and North Carolina are 1. North Carolina is not dominated by a single metro area and 2. Democrats had further to fall in the state’s bottom half in North Carolina but did not in Georgia, at least at the moment. (My colleague J. Miles Coleman took a deeper look at North Carolina trends for the Crystal Ball recently.) Demographically, it is also worth noting that about one-third of Georgia’s residents are Black while less than one-quarter of North Carolina’s are, which is likely another larger-scale factor keeping the latter in the red column.

Top half: The 8 counties in this group are all in southeast/south-central Pennsylvania with the exception of Allegheny (Pittsburgh), which narrowly trails Philadelphia County as a source of votes in presidential elections despite only having a population roughly 80% the size of Philadelphia. Philadelphia’s core suburban counties — Montgomery, Bucks, Delaware, and Chester — along with growing Lancaster and York to Philadelphia’s west round out the list. Obama won 5 of the 8, losing Chester, Lancaster, and York. Biden won 6 of the 8, adding Chester.
Bottom half: The other 59 counties: Obama won 8, Biden won 7. They both won the same total number of counties statewide (13), with the only difference between the two being that Obama lost Chester in the Philadelphia suburbs while carrying Luzerne (Wilkes-Barre) in the northeast — Biden won the former and lost the latter, which is adjacent to his childhood home in Lackawanna (Scranton).
Pennsylvania’s top and bottom halves are now very similar to North Carolina’s, as they are close to being mirror opposites of one another. Like many of the states in the Midwest, Republicans have gotten much stronger in Pennsylvania’s bottom half counties in the Trump era, although the Pennsylvania top half has gotten a little bluer.
The Keystone State is often lumped in with the 2 other so-called “Blue Wall” states of Michigan and Wisconsin, which together have all voted Democratic in every presidential election since 1992, with the exception of 2016. Compared to those states, Pennsylvania’s top half is bluer — but its bottom half is redder. It does bring to mind the old adage attributed to Democratic strategist James Carville that the state is Pittsburgh and Philadelphia with Alabama in between (although that’s apparently not exactly what he said, as Politico noted many years ago).
That said, Biden did run better than Hillary Clinton in much of the state (including almost all of its eastern half, with Philadelphia itself being one of just a few exceptions). This helps explain how he flipped the state back after she narrowly lost it. But Democrats are in trouble in Pennsylvania if the native Pennsylvanian’s candidacy was only effectively a rearguard action against more significant Democratic erosion in the smaller counties. Democrats performed quite well in Pennsylvania in the 2022 midterm — but they also did in 2018, and that didn’t prevent the 2020 election from being a nail-biter.

Top half: The largest source of votes in the Palmetto State is not Charleston County (which is second), but rather Greenville in the northwestern part of the state. Its eastern neighbor, Spartanburg, is fifth. The others in this group are Richland (Columbia) and its western suburban neighbor Lexington in the center of the state, Horry (Myrtle Beach) on the state’s northern coast, and York, which is just south of Charlotte on the other side of the North Carolina border. Obama and Biden each carried just 2 of the 7: Charleston and Richland.
Bottom half: The other 39 counties; Obama carried 19 while Biden carried 11. Some of the state’s smaller, rural counties are majority Black (as is the case in other Southern states) and heavily Democratic. Still, Republicans generally dominate the most vote-rich counties in the bottom half.
South Carolina is the least competitive state among these 6, but we included it basically just to show why it is staunchly Republican even as its 2 neighbors along the coast — North Carolina to the north and Georgia to the southwest — are 2 of the nation’s premier battlegrounds.
South Carolina’s big counties, collectively, are not blue, nor are they really even purple. While the state’s top half got a little less red from 2012 to 2020, Trump still won the group by 9 points. Of the 13 states we’ve looked at as part of this series, it’s the only state so far where Trump won the top half. Interestingly, South Carolina’s bottom half was actually less red than its top half in 2012, which likely is explained by the voting habits of several smaller, heavily Black rural counties predominantly located between Columbia and Charleston in the southeastern half of the state. But by 2020, the familiar pattern of the top half being more Democratic than the bottom half had been established in South Carolina.
In order for the state to get competitive, one would need to see a real Democratic trend in the top half, including big swings to the left in historically conservative and strongly Republican places like Greenville and Spartanburg in upstate South Carolina. Greenville actually did get less Republican from 2012 to 2018, but it went from a 28-point Romney margin to an 18-point Trump margin (and Spartanburg actually got a few points redder over the same timeframe). Something much more dramatic than that is needed to make South Carolina an actual swing state, and South Carolina was actually a little closer for president in 2012 than it was in 2020.
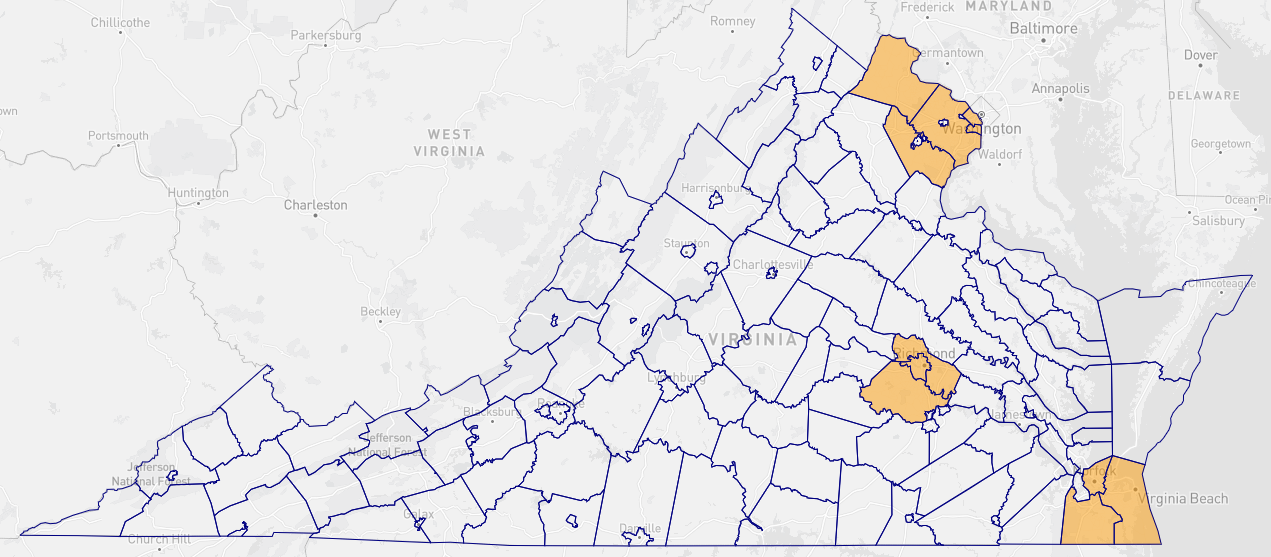
Top half: All 11 of the localities included here are based in Northern Virginia, Greater Richmond, or Hampton Roads — the 3 components of the state’s heavily-populated “Urban Crescent.” We say “localities” because Virginia has both counties as well as independent cities. Fairfax County is by far the biggest voting locality in the state, casting more than double the votes of anywhere else, although it only casts about 13% of the total statewide vote. Prince William, Loudoun, and Arlington counties as well as Alexandria City join it as Northern Virginia components of the top half. The 3 core Richmond localities — the city itself plus neighboring suburban Chesterfield to its south and Henrico to its north — as well as the biggest Hampton Roads localities, the independent cities of Virginia Beach, Chesapeake, and Norfolk, round out this group. Biden won all 11 of these counties/cities; Obama won all but Chesterfield and Virginia Beach.
Bottom half: The other 122 counties/independent cities. Biden carried 35, comparable to the 37 that Obama carried.
The trajectory of Virginia’s top half from 2012 to 2020 mirrors that of the top half of Georgia, as both zoomed roughly 15 points toward the Democrats in terms of margin. Biden won the top half of Virginia by 32 points, a margin greater than the 30 points by which Biden won the top half of Minnesota, which we explored last week. Meanwhile, the Republican margin in the bottom half of Virginia was only about 11 points, or just about 3 points better than it was in 2012.
Democrats are buoyed by the presence of several key voting centers among the bottom half counties/cities, such as overwhelmingly Democratic Newport News, which was the biggest source of votes in the bottom half. There are paths for Republicans to win statewide — as shown in the 2021 state elections — but Virginia has still pretty clearly moved toward the Democrats in federal elections.
Table 7 shows how these 6 states voted in 2020 overall, as well as how their top and bottom halves voted. In all 3 sections, the states are ranked from most Democratic to most Republican.
Some takeaways:
— Virginia had both the bluest top and bottom halves, unsurprising for a state that is much more Democratic than the other 5 at the federal level.
— Georgia had the second-bluest top half, but also the reddest bottom half, which contributed to the state’s tiny margin in favor of Biden in 2020. However, the top half got way bluer from 2012 to 2020 while the bottom half hardly moved at all, so the arrow may be pointing up for Democrats in Georgia moving forward.
— There are more than 40-point marginal gaps between the top and bottom halves of both North Carolina and Pennsylvania, with the top halves each being around 20-point Democratic margins and the bottom halves each being around 20-point Republican margins. Each gave their winning presidential candidate a margin of just a little over a point in 2020, so it wouldn’t take much change to flip either.
— Florida’s top half is considerably less blue than those of Georgia, North Carolina, Pennsylvania, and Virginia, which goes a long way toward explaining why it’s become redder than those other states.
— South Carolina’s bottom half is not very red compared to the others, but its top half definitely is.
| Dear Readers: Join us on Monday, April 3 for “Drawing the Lines: Political Cartoons in the Digital Age,” a conversation with 4 of the nation’s top political cartoonists. Center for Politics Director Larry J. Sabato will moderate the discussion with Lalo Alcaraz, winner of the 2022 Herblock Prize and two-time Pulitzer finalist; Darrin Bell, Pulitzer-winning political cartoonist and creator of the comic strip “Candorville”; Ann Telnaes, Pulitzer-winning editorial cartoonist for the Washington Post; and Matt Wuerker, Pulitzer-winning staff cartoonist and illustrator for Politico.
The program begins at 6:30 p.m. eastern at Ridley Hall, Room G008, on the Grounds of the University of Virginia. It is free and open to the public to attend with advanced registration through Eventbrite; it will also be livestreamed at https://livestream.com/tavco/thepowerofpoliticalcartoons. — The Editors |
— This piece analyzes recent presidential voting patterns in the Midwest by comparing the big counties that cast roughly half the statewide vote with the smaller counties that cast the rest of the statewide vote.
— In Illinois and Minnesota, more than half of the statewide vote comes from dominant metro areas, and improvements in those areas from 2012 to 2020 allowed Democrats to maintain their strong position in both states.
— The smaller-county halves of Iowa and Ohio have zoomed right, pushing them out of the roster of competitive states.
— The bottom hasn’t dropped out for Democrats in nearly the same way in Michigan and Wisconsin.
A couple of weeks ago, I gave a presentation back home in Cleveland about the trajectory of Ohio’s presidential voting. The book I wrote several years ago about the state, The Bellwether, is clearly a work of history now, examining what was as opposed to what is. The Buckeye State has moved to the right, removing it from its long-held position as one of the nation’s key presidential bellwethers.
One of the main factors driving that change is a clear Republican shift in the state’s smaller counties — back in 2012, I noted to the audience, there were just 6 of Ohio’s 88 counties that gave Mitt Romney more than 70% of the vote. By 2020, 44 counties — fully half of the state’s total — had given Donald Trump greater than 70%.
However, it is worth remembering that half of a state’s counties does not mean half of a state’s votes. Those 44 Ohio counties that gave Trump landslide margins cast just about 15% of the statewide vote in 2020. Starting from the county that cast the least votes and working up, you would need to put together 79 of the 88 counties to get roughly half the statewide vote in Ohio. The other half of the vote is cast by just the 9 biggest-voting counties.
This got me thinking about looking at the Midwest more broadly, and dividing not just Ohio, but also 6 other classically-defined Midwest states (Illinois, Indiana, Iowa, Michigan, Minnesota, and Wisconsin) into halves, and comparing how they voted in 2012 (when Barack Obama won all but Indiana) to 2020 (when Joe Biden beat Donald Trump in 4 of the 7, with the former winning Illinois, Michigan, Minnesota, and Wisconsin, and the latter carrying Indiana, Iowa, and Ohio).
What follows is an examination of how these states vote, divided into halves: the votes cast by the biggest counties adding up to roughly half the state (which we’ll call the top half) compared to the other half of the vote cast by the rest of the state (which we’ll call the bottom half). The story told is a familiar one: Throughout the Midwest, the vote cast by the top half is markedly more Democratic than the vote cast by the bottom half, and the bottom half generally zoomed right from 2012 to 2020 while the top halves varied.
The location and voting habits of the more populous counties in a state also factors into the differences among them. Illinois and Minnesota, for instance, are dominated by their respective main metro areas (Chicago and the Twin Cities), which helps explain why they are the most Democratic states in the region. Likewise, the diffuse nature of Indiana, Iowa, and Ohio’s most vote-rich counties combined with the strong Republicanism of their smaller counties accounts for their recent surge to the right (particularly in the case of Iowa and Ohio, which both voted for Obama twice but are no longer credible Democratic presidential targets). This also gets at the urban versus rural divide in these states, although we don’t really use that distinction in our commentary below, largely because it oversimplifies the divide between the big county half and the small county half. As you’ll see, there are lots of decently-sized or even big counties that are not included in the “top” half in each state, meaning that we wouldn’t really call them “rural.”
Before we go state by state, let’s explain how we did this. We used our favorite source for presidential election results, Dave Leip’s Atlas of U.S. Presidential Elections, and sorted the counties in each state according to how many votes they cast in 2020. Starting with the most vote-rich county, we kept adding counties until we got closest to half the statewide vote. As you’ll see in the tables, this was different for every state, as we did not split any counties, so the total share of the vote cast by the group of bigger counties ranged from about 49%-52% of the vote. We calculated the voting patterns for each “half” of the state — the big county group (top half) versus the small county (bottom half) group — and then compared how each half voted in 2012. Even though in a few instances the lineup of counties in each group was a little different in 2012 than 2020, we stuck with the 2020 order when looking at the 2012 results — and the tables show what percentage of the vote each group of counties cast in both elections. Percentages in the tables may not add precisely to 100% because of rounding.
The maps shade the counties included in the top half group in each state in orange; all of the remaining counties, combined, cast roughly the other half of the vote in the state and make up the bottom half group. We created the maps using Dave’s Redistricting App.
Top half counties that add up to half the statewide vote: Cook, DuPage, and Will. Cook is Chicago, while DuPage and Will are 2 of its collar counties. Back in 2012, one of the other collar counties — Lake, directly north of Cook — was the third-largest source of votes, but it has since been surpassed by Will, which is directly south of Cook.
Bottom half counties that make up the rest of the state: 99 of the state’s 102 counties, including the other Chicago collar counties: Lake, Kane, and McHenry.
Illinois, which at one time was a bellwether state, is dominated by Chicago and its collar counties: Those 6 counties cast nearly two-thirds (64%) of the statewide vote in 2020, with Cook itself accounting for 38%. The interplay between Chicago and its suburbs kept Illinois competitive: Cook has long been Democratic (although it has gotten bluer more recently), the collars were long Republican, and downstate was marginal. But Joe Biden carried all of the collar counties except for narrowly losing McHenry in 2020, and while Republicans have gained downstate, those improvements have been canceled out by Democratic gains closer to Chicago. The changes have kept Illinois in Democratic-leaning stasis: Its margins in favor of Democrats in the last 3 presidential elections were nearly identical each time. Barack Obama won the state by 16.84 percentage points in 2012, Hillary Clinton won it by 16.88, and Biden won it by 16.94.
Top half: Marion (Indianapolis), along with 3 of its collar counties (Hamilton to the north, Hendricks to the west, and Johnson to the south); Lake and Porter in the northwest; St. Joseph (South Bend) and Elkhart in the north central; Allen (Fort Wayne) in the northeast; and Vanderburgh (Evansville) in the southwest. Biden carried only Marion, Lake, and St. Joseph.
Bottom half: The other 82 counties. Biden carried only 2: Monroe and Tippecanoe, home of, respectively, Indiana University and Purdue University.
Of these 7 states, Mitt Romney carried only Indiana in 2012. This was after the state voted very narrowly for Obama in 2008, which was a blip in what is otherwise a clearly Republican-leaning state.
The Hoosier State’s biggest source of votes is Marion County (Indianapolis). But it only casts about 13% of the statewide vote. Several of its surrounding suburban/exurban counties are also in the bigger county bloc, as are several northern counties covering Gary/Hammond (Lake) and South Bend (St. Joseph). Fort Wayne’s Allen County and Evansville’s Vanderburgh are also in this group. As it was, Biden actually performed slightly better than Obama in the bigger counties, but they were very closely contested, while the Republican margin swelled in the counties in the smaller-county half. As Illinois is the most Democratic state in the region, Indiana is the most Republican, and an examination of its halves tells the tale: The big county portion is only barely Democratic, and the small county portion is redder than any other examined here.
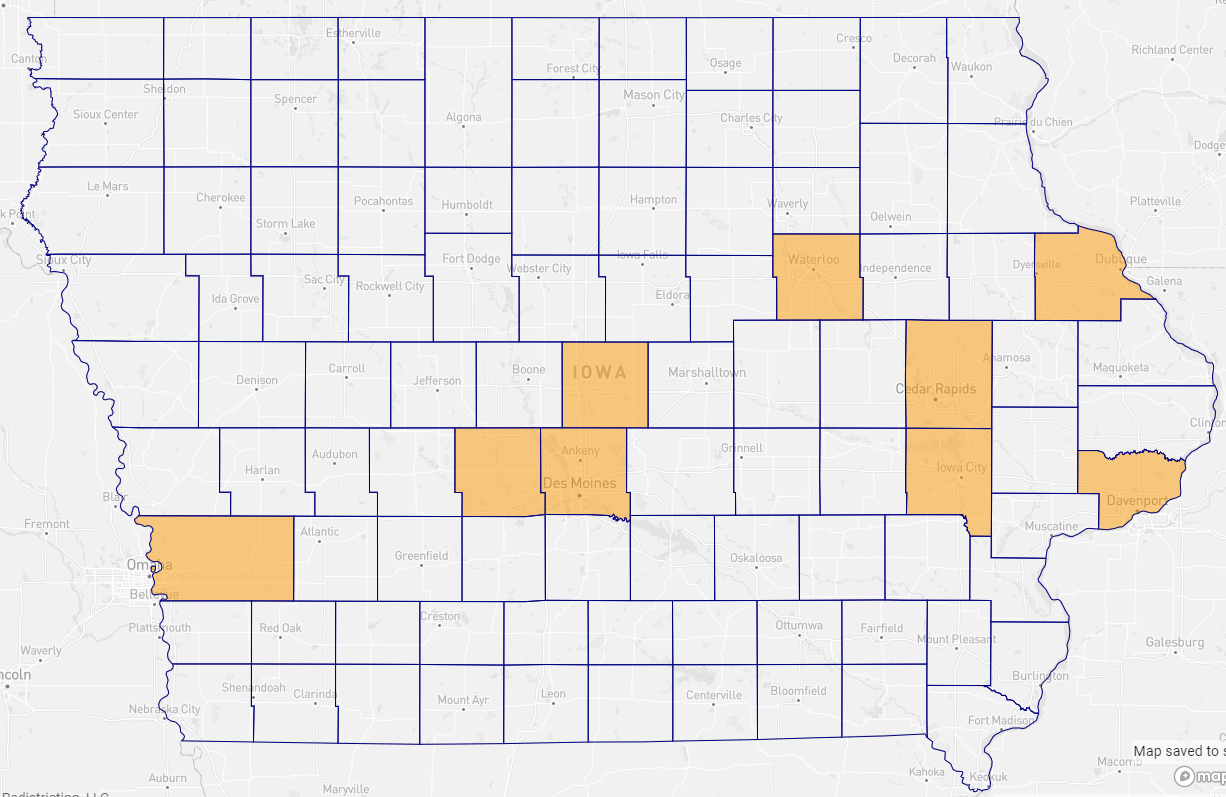
Top half: Polk (Des Moines) casts only about 15% of the statewide vote. It’s joined in this group by its growing suburban/exurban western neighbor, Dallas, and its northern neighbor, Story. The other major vote centers are mostly east of Des Moines: Black Hawk (Waterloo), Dubuque, Linn (Cedar Rapids), Johnson (Iowa City), and Scott (Davenport). Pottawattamie, in the southwest, is on the other side of the state border from Omaha, Nebraska. The only county that switched from 2012 to 2020 was Dubuque, which voted for Obama by 15 but Trump by 3.
Bottom half: 90 other counties. Obama carried 31 of them in 2012; Biden carried none.
No state in the region swung as heavily Republican between 2012 and 2020 as Iowa, which went from a 6-point Obama victory in 2012 to an 8-point Trump win in 2020. The Democratic fall was largely about the smaller counties: Biden’s margin in the bigger counties was 12 points, just 3 points worse than Obama’s 2012 margin. Biden lost a lot of ground in the big population centers of eastern Iowa, with the exception of the most Democratic county in the state, Johnson, home to the University of Iowa. But he did better than Obama in the 3 vote centers in central Iowa: Polk (Des Moines), as well as its western neighbor, Dallas, and Story to its north, home of Iowa State University.
The big change was that Obama came within about 2.5 points of carrying the small-county group in 2012; Biden lost it by nearly 30 points. This was the biggest swing of any of the state halves we examined in this region.
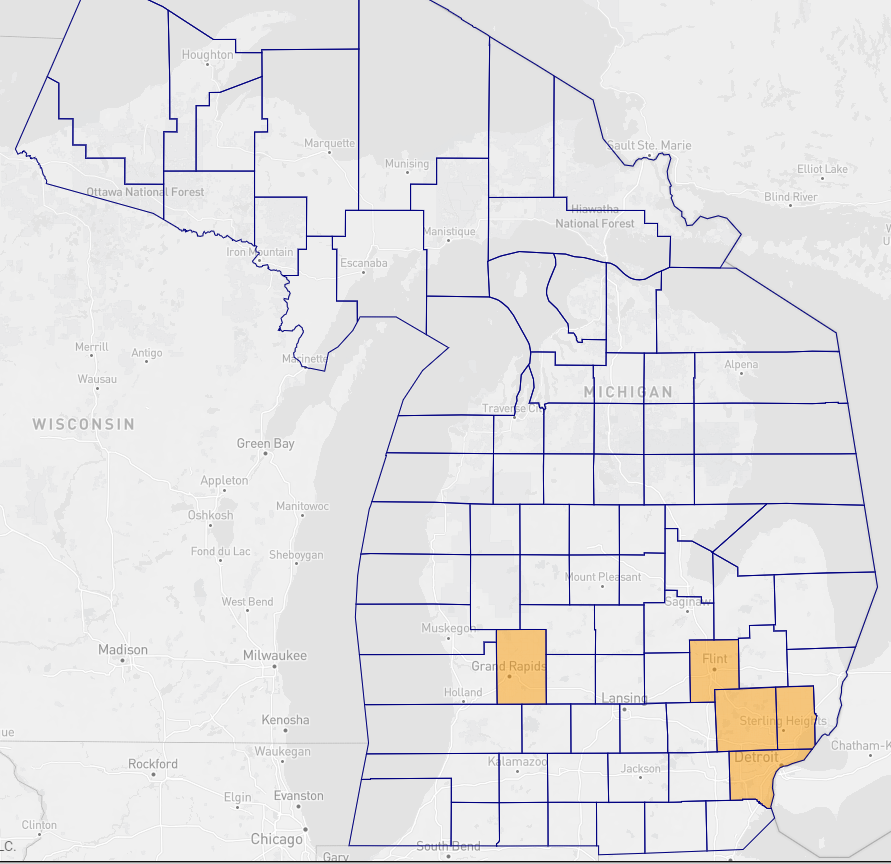
Top half: Wayne (Detroit), along with its suburban neighbors, Oakland to the northwest and Macomb to the northeast. Genesee (Flint) is just outside of Detroit’s orbit, while Kent (Grand Rapids) is in western Michigan. Biden won 4 of 5, losing only Macomb; Obama won 4 of 5, losing only Kent. While pro-Democratic suburban trends have shifted Kent and Oakland leftward, the other 3 have swung rightward to varying degrees.
Bottom half: This group contains 78 of the state’s 83 counties. Washtenaw, which was the bluest county in the state in 2020 and is the home of the University of Michigan, is the biggest county in this group. Biden won 7 of these counties, down from Obama’s 16.
Michigan’s big half vs. small half dynamic is somewhat similar to Illinois and Minnesota, in that a lot of its vote is concentrated in a single metro area (Detroit), but Detroit does not quite dominate Michigan the way that Chicago or the Twin Cities dominate their respective states — which is part of why Michigan is more competitive than the other two, at least at the moment. Another key difference is that Macomb, the suburban/exurban Detroit county that became synonymous with the so-called “Reagan Democrats,” is not a Democratic-leaning county (it voted for Obama twice, but also Trump twice). Democrats have seen erosion in both the top and bottom county halves, but the decline in the latter is more modest than many of these other states, probably because there are some major Democratic vote anchors included in that group, including Washtenaw and Ingham (home to Lansing, the state capital, and Michigan State University) as well as Kalamazoo (Western Michigan University).
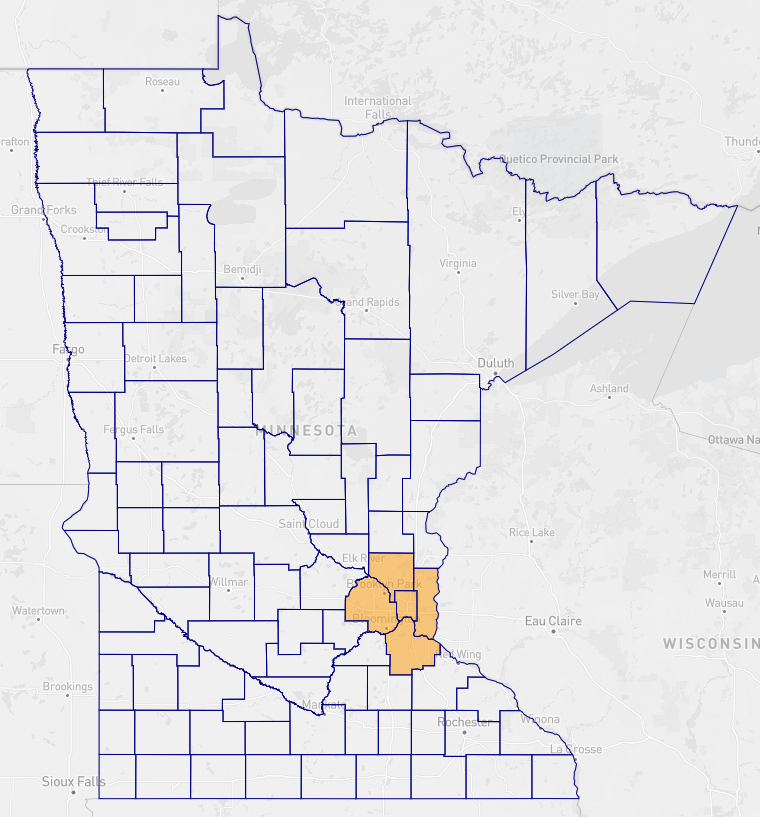
Top half: All 5 are anchored in the Twin Cities: Hennepin, by far the state’s largest source of votes, covers Minneapolis, while Ramsey contains Saint Paul. Dakota is to the Twin Cities’ south, Anoka is to its north, and Washington is to its east. Both Obama and Biden carried 4 of the 5 counties, as they both lost Anoka, although only by a few points apiece.
Bottom half: A couple of the counties covered by the Twin Cities’ Metropolitan Council, Carver and Scott both to the southwest of the Twin Cities, are included in this group, underscoring the political weight of the Twin Cities metro area. Carver and Scott are Republican but getting more competitive: In 2012, Carver was Romney’s 13th best county in the state, but by 2020, Trump did better in 69 other counties. Scott has seen similar trends. More broadly, this group includes 82 of Minnesota’s 87 counties. Obama carried 24 but Biden only carried 9.
The Twin Cities provide a strong anchor for Democrats: Together, Hennepin and Ramsey counties cast a little under a third of the statewide vote (32%), and they gave Biden a 44-point margin. They do not quite have the weight of Cook in Chicago — 38% of the statewide vote and a 50-point Democratic margin — but they are comparable. The movement in the 5 key Twin Cities counties has made that half of the vote much bluer in 2020 than it was in 2012 — a 30-point Democratic margin for Biden compared to 19 for Obama.
Meanwhile, the rest of the state has indeed moved right, collectively: The roughly 13-point Republican improvement in margin is effectively the same as Wisconsin’s change in its half of smaller counties, and the overall Republican margin in Minnesota’s bottom half counties was actually a couple points better in 2020 than Wisconsin’s. But the Twin Cities are just bluer than the collection of Wisconsin counties that make up its heaviest-voting areas.
The net result of these changes is that Minnesota’s overall statewide margin was very similar in 2012 and 2020, with Democrats winning the state by 7.7 points in 2012 and 7.1 in 2020. (Trump did come within 1.5 points of carrying Minnesota in 2016, but the full weight of Trump-era realignment stabilized Democratic performance in 2020.)
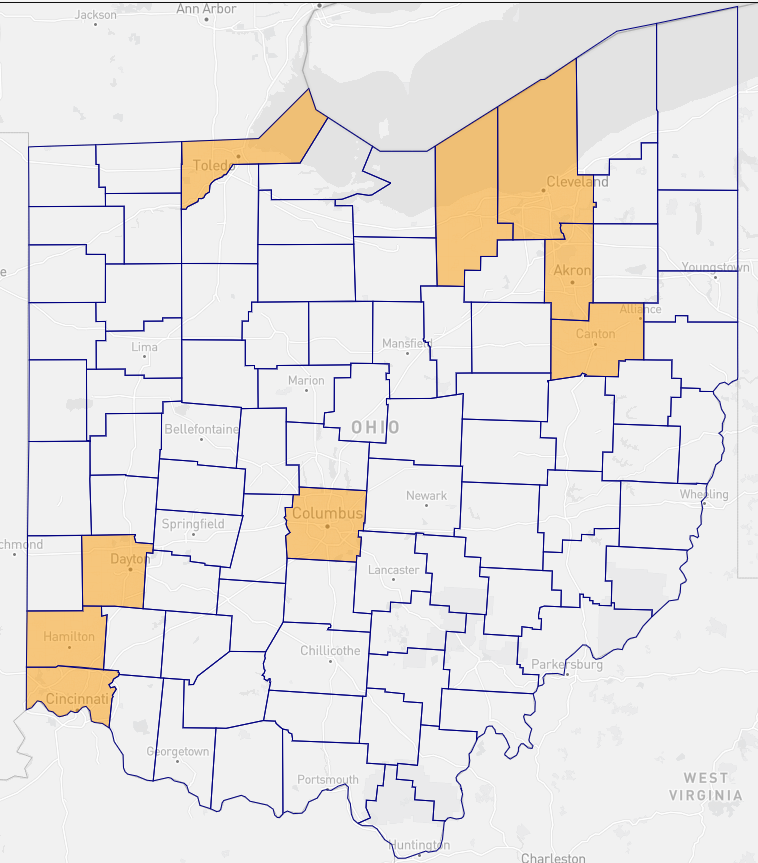
Top half: The “3 Cs” big city counties — Cuyahoga (Cleveland) in the northeast, Franklin (Columbus) in the center of the state, and Hamilton (Cincinnati) in the southwest — cast a little less than 30% of the statewide vote. The other pieces of this group are Lorain and Summit (Akron), located to Cleveland’s west and south, respectively; Stark (Canton), south of Summit; Lucas (Toledo) in the northwest; and Montgomery (Dayton) and Butler (suburban/exurban Cincinnati, plus Miami University) in the southwest. Romney only won Butler; Trump added Lorain and Stark.
Bottom half: The remaining 79 other counties include the red suburban/exurban collar counties around the big urban centers not previously mentioned, as well as Obama-to-Trump bastions like Mahoning (Youngstown) and Trumbull (Warren) in northeast Ohio on the Pennsylvania border. Obama won 9 of these counties, while Biden won just 1: little Athens in the southeast, home to my alma mater, Ohio University (and even then, Biden’s 15-point margin was 20 points less than Obama’s).
Collectively, Biden held up OK in the half of bigger counties, running only about 2.5 points in margin behind Obama. That’s largely because Franklin and Hamilton are getting bluer even as the others are not as blue as they used to be — or even flipped to Trump, like Lorain and Stark in Northeast Ohio. At one time, Stark was seen as a bellwether county: Perhaps no single county in the whole country got as much attention as it did during the 2004 presidential election (and John Kerry actually carried it even as George W. Bush was winning the state and the election). But Trump won Stark by about 19 points.
Meanwhile, Trump won the bottom half of Ohio by 32 points, just a couple points shy of Indiana’s tally and a margin much larger than that in Michigan, Minnesota, and Wisconsin. Iowa and Ohio have both moved clearly right of center because those states’ smaller counties have zoomed right while the big ones, collectively, have also gotten a little less Democratic, too.
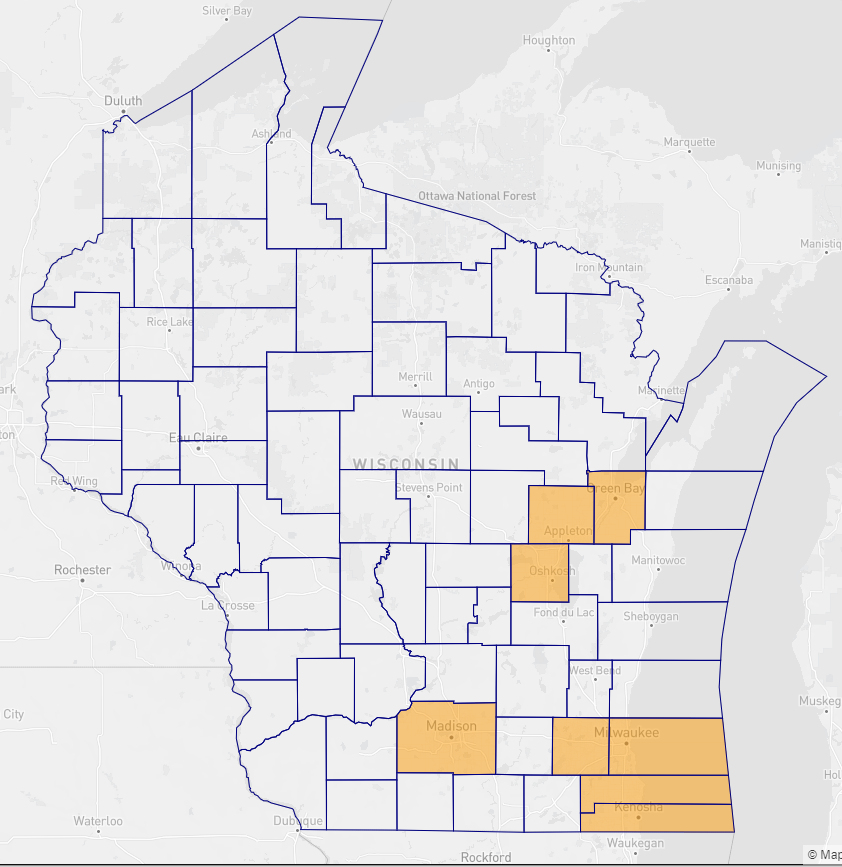
Top half: Milwaukee and Dane (Madison) together cast a quarter of the statewide vote. Joining them are a few counties in Milwaukee’s orbit: Waukesha, a suburban county directly west of Milwaukee, and Racine and Kenosha directly south. The other 3 counties in this group are Brown (Green Bay), Outagamie (Appleton), and Winnebago (Oshkosh), 3 adjacent counties in central/eastern Wisconsin sometimes called the “BOW” counties. Biden carried only Milwaukee and Dane, although many are competitive (Obama carried Kenosha, Racine, and Winnebago as well).
Bottom half: This group has 64 of Wisconsin’s 72 counties. Obama won 30 of these counties, while Biden won only 12. There are some Democratic-leaning counties in this group, such as La Crosse and Eau Claire, although the biggest single source of votes in this group (albeit casting just about 2.5% of the statewide vote) is Washington County, the reddest of the so-called “WOW” suburban counties around Milwaukee (the others are the aforementioned Waukesha west of Milwaukee and Ozaukee north of Milwaukee — the Republican margin in each dropped double digits from 2012 to 20202, while it only fell a couple of points in Washington).
The story in Wisconsin takes from both the pro-Democratic and pro-Republican trends seen in other states. Democrats actually did a little bit better in the top half in 2020 than in 2012, making Wisconsin similar (at least in terms of direction) to Illinois and Minnesota. However, the Wisconsin top half is still considerably less Democratic than the top halves of those bluer states. Meanwhile, Republicans did make big gains in the bottom half, although the gains were not as big as those seen in redder Iowa and Ohio.
Milwaukee has gotten a little bluer in terms of margin, but it also is the only county in the state that saw its total votes cast decline from 2012 to 2020, likely both because of the county’s falling population and also reduced Black turnout from the very high levels of the Obama era (Cleveland’s Cuyahoga County is experiencing something similar, but the difference is that Cuyahoga’s Democratic margin of victory got smaller, too, from 2012 to 2020). In 2020, the closer-in suburbs actually cast 7,000 more votes than they did in 2012, but that was more than offset by the 40,000-vote drop in the city itself over the same period. That Milwaukee dynamic helps explain why the top half counties cast a slightly larger share of the vote in 2012 than they did in 2020.
Dane, meanwhile, has explosive growth and is getting more Democratic, to the point where it actually produced a bigger percentage margin for Democrats than Chicago’s Cook County did in 2020. But Dane only casts about 10% of the statewide vote, making it far less impactful in Wisconsin than Cook is in Illinois.
A little bit more erosion for Democrats in the bottom half would likely doom them in Wisconsin — however, it’s not clear that will happen, as Democrats held up OK there in 2022 as they held the governorship and came close to unseating Sen. Ron Johnson (R-WI). For more on Wisconsin, see my colleague J. Miles Coleman’s state Supreme Court race preview, which we published yesterday.
Table 8 lists the 2020 results in each of these 7 states, essentially summarizing the tables from above.
Some takeaways:
— Illinois has both the most Democratic top and bottom halves, explaining its position as the most Democratic state in the region. The presence of several populous Democratic-trending Chicago collar counties in the “bottom half” is a big reason why. Likewise, Indiana has the reddest halves in both categories, explaining its position as the most Republican state in the region.
— Minnesota’s bottom half is actually redder than Michigan’s and Wisconsin’s, but the Twin Cities metro sets the political tempo for the state and has zoomed left over the past decade.
— While its top half is way less Democratic, Michigan’s bottom half is comparable to that of Illinois, in part because Michigan’s bottom half contains some significant Democratic vote centers, like Ann Arbor and Lansing.
— Ohio’s top half is fairly similar to Michigan’s and Wisconsin’s, but its bottom half is way redder — more Republican even than Iowa’s, which also has moved quickly right over the past decade.
![]()
Students walking between classes at the University of Idaho. The state will ban student ID cards as a form of voter identification, one of few successes for Republicans targeting young voters this year.
2024 presidential hopeful Mike Pence doesn't seem to understand how much Republicans hate him for not overturning the election when he demanded it. And here's another clear piece of evidence he'll ignore: when former Trump press secretary Kayleigh McEnany tweeted praise for Pence, saying that "his patriotism, love for the country, and love for his Savior on full display," she faced a storm of backlash from MAGA supporters, who called her a "traitor," a "turncoat," a "RINO," and a "disgusting" person. — Read the rest
— The American electorate has changed dramatically over the past 40 years, and a pair of factors — race and education — have driven the changes.
— The electorate has become more diverse and more highly educated. Democrats rely heavily on nonwhite voters and have improved with white college-educated voters, while Republicans have cut deeply into Democratic support with non-college whites.
— Racial and cultural issues, rather than economic ones, have fueled Republican gains with the non-college white electorate.
The American electorate has changed dramatically over the past 4 decades. This transformation has involved changes in both the demographic composition of the electorate and the party loyalties of major demographic groups. In this essay, I describe long-term trends in the demographic composition of the electorate and in the party loyalties of key demographic groups, focusing on two crucial demographic variables: race and education. I then examine the forces driving the striking shift in the party loyalties of the group that still makes up the largest share of the American electorate — white voters without a college degree, a group often referred to as the white working class.
Figure 1 displays trends in the demographic composition of the American electorate between 1980 and 2020. The data displayed in this graph show that the electorate that voted for Joe Biden in 2020 was very different from the electorate that voted for Ronald Reagan in 1980. Over these 40 years, the electorate has become both more racially diverse and more educated. The white share of the electorate has fallen from 84% in 1980 to 66% in 2020. At the same time, the share of the electorate without a college degree has fallen from 84% in 1980 to 63% in 2020.
Source: American National Election Studies Cumulative File
The combined impact of growing racial diversity and rising levels of education is that the share of the electorate made up of whites without a college degree has fallen drastically, from 69% in 1980 to 39% in 2020. In 40 years, non-college whites have gone from an overwhelming majority to a minority of the American electorate. This decline in the non-college white share of the electorate has been very consistent, averaging about 3 percentage points every four years, and shows no signs of abating. At this rate of decline, the proportion of the electorate made up of non-college whites will fall to approximately 30% by 2032.
The dramatic changes in the composition of the American electorate over these 40 years, especially the substantial decline in the white share of the electorate, would appear to favor the Democratic Party because it has historically received the large majority of the nonwhite vote. However, despite the decline in the white share of the electorate, the data displayed in Figure 2 show that the proportion of Americans identifying with the Republican Party actually increased between 1980 and 2020. Although this trend has been uneven, the Democratic advantage in party identification has declined steadily since 2008, falling from 13.9 percentage points to only 4.1 percentage points over these 12 years. The 4.1 percentage point Democratic advantage in party identification in 2020 was the smallest recorded in ANES surveys in the past 40 years.
Note: Democratic and Republican identifiers, including leaning independents
Source: American National Election Studies Cumulative File
In order to understand how the Democratic Party’s advantage in party identification has been shrinking even as the nonwhite share of the electorate has been growing, we have to examine trends in the party identification within different racial groups. Figure 3 displays these trends among whites, Blacks, and other nonwhites — a category that includes Latinos, Asian Americans, Native Americans, and persons of mixed racial ancestry.
The most significant long-term trend apparent in these data is the decline in Democratic identification among white Americans. In 1980, Democrats enjoyed an 11-point advantage in party identification among whites. As recently as 2000, Democrats still enjoyed a 2-point advantage in party identification among whites. However, between 2008 and 2020, a 2-point Democratic deficit among whites turned into a 16-point deficit.
No such long-term shift in party identification is apparent in these data among either Blacks or other nonwhites, although there have been some short-term swings within these groups, especially among other nonwhites. The Democratic advantage among other nonwhites did fall from 39 points in 2008 to 25 points in 2020. However, that 39-point lead in 2008 was considerably larger than in any of the previous 4 elections. This variability in party identification among other nonwhites may reflect both short-term effects of the national political environment and random variation due to relatively small sample sizes.
Source: American National Election Studies Cumulative File
Along with race, the other key demographic characteristic that has undergone substantial change over these 40 years is education. According to the ANES data, the proportion of eligible voters with a college degree more than doubled between 1980 and 2020, going from 16% to 37%. The proportion of college graduates rose from 17% to 40% among whites and from 11% to 30% among nonwhites.
As the proportion of college graduates has grown since 1980, there has been a dramatic realignment in party identification along educational lines. According to the ANES data, during the 3 elections between 1980 and 1988, Democrats enjoyed an average advantage of 14 points in party identification among Americans without a college degree. At the same time, Republicans enjoyed an average advantage of 5 points in party identification among college graduates. By 2016-2020, the Democratic advantage among Americans without a college degree had fallen to only 1 point while the 5-point Republican advantage among college graduates had turned into a 14-point Democratic advantage.
Note: Net party identification measured by difference between percentage of Democrats and percentage of Republicans, including leaning independents. In order to ensure adequate numbers of nonwhite respondents, the data are grouped into 4 electoral eras: 1980-1988, 1992-2000, 2004-2012, and 2016-2020.
Source: American National Election Studies Cumulative File
Since the election of Donald Trump in 2016, some pundits and political observers have argued that a class-based realignment of American politics has been occurring among nonwhites as well as among whites. According to analysts like Ruy Teixeira, declining support among nonwhites without college degrees is becoming a major problem for the Democratic Party. However, the data displayed in Table 1 indicate that the realignment of support along educational lines in recent elections has thus far been confined mainly to white Americans.
The data displayed in Table 1 show that over this 40-year period, there was a very dramatic realignment along educational lines among white Americans. Between the Reagan-H.W. Bush era and the Trump-Biden era, Democratic identification collapsed among non-college whites. At the same time, Democratic identification increased substantially among white college graduates. No such realignment is apparent in these data among either Blacks or other nonwhites, however. By 2016-2020, there was a yawning divide in party identification between non-college whites and college-educated whites. In contrast, there was very little difference in party identification between Blacks with and without college degrees or between other nonwhites with and without college degrees. The so-called class divide in American politics today appears to be almost entirely a white phenomenon.
There are two prominent explanations for the dramatic realignment of party identification among white Americans along educational lines since the 1980s. One explanation for this realignment emphasizes economic stress and insecurity caused by changes in the structure of the American economy that have disproportionately affected those without a college degree. The other explanation emphasizes racial and cultural resentment caused by changes in American society that disproportionately affect those without college degrees because they tend to hold more conservative attitudes on racial and cultural issues. I will test both of these explanations using data from ANES surveys between 1980 and 2020.
Note: Net party identification measured by difference between percentage of Democrats and percentage of Republicans, including leaning independents
Source: American National Election Studies Cumulative File
In order to examine the role of economic stress and insecurity in driving support for the Republican Party among non-college whites, I examined the relationship between family income and party identification among college and non-college whites in 2020. One would expect that to the extent that economic stress and insecurity are causing whites to move toward the GOP, there should be an inverse relationship between family income and Republican identification among both non-college and college-educated whites. In addition, the gap in party identification between non-college and college-educated whites should become much smaller or disappear once we control for family income.
The findings displayed in Figure 4 provide no support for the economic stress hypothesis. There was only a weak relationship between family income and partisanship among whites in 2020 and among non-college whites, those with lower incomes were actually somewhat less likely to identify as Republicans than those with higher incomes. Moreover, at every income level, whites without college degrees were much more likely to identify as Republicans than those with college degrees.
Note: Net party identification measured by difference between percentage of Democrats and percentage of Republicans, including leaning independents
Source: American National Election Studies Cumulative File
To test the racial and cultural resentment hypothesis, I examined the relationship between the standard 4-item racial resentment scale and party identification among whites with and without college degrees. The results are displayed in Figure 5. The findings here contrast dramatically with those in Figure 4. There is a very strong relationship between racial resentment and party identification among those with and without college degrees. Whites who scored low in racial resentment identified overwhelmingly with the Democratic Party while those who scored high in racial resentment identified overwhelmingly with the Republican Party. Moreover, once we control for racial resentment, the educational divide in partisanship disappears completely. In fact, at moderate to high levels of racial resentment, whites with college degrees were slightly more likely to identify as Republican than whites without college degrees.
Note: Net party identification measured by difference between percentage of Democrats and percentage of Republicans, including leaning independents. In order to ensure adequate numbers of nonwhite respondents, the data are grouped into 4 electoral eras: 1980-1988, 1992-2000, 2004-2012, and 2016-2020.
Source: American National Election Studies Cumulative File
The findings in Figures 4 and 5 indicate that racial and cultural resentment rather than economic distress and insecurity has been driving non-college whites toward the Republican Party in recent years. As one additional test of this hypothesis, I analyzed the relationship between racial resentment and partisanship among non-college whites over time. The results of this analysis, displayed in Figure 6, strongly support the racial/cultural resentment hypothesis. Over these 40 years, the relationship between racial resentment and partisanship became much stronger among whites without college degrees. At the beginning of this time period, non-college whites who scored very high on the racial resentment scale were only slightly more likely to identify as Republicans than as Democrats. By the last 2 elections in this series, however, those who scored very high on the scale identified overwhelmingly as Republicans. Meanwhile, over the same 40-year time period, non-college whites who scored very low on the racial resentment scale actually shifted strongly in the direction of the Democratic Party.
The evidence examined in this article indicates that the realignment of party identification along educational lines among Whites has actually been a realignment of party identification based on racial and cultural resentment. As a result of this realignment, white Democrats today, regardless of education, are much more likely to hold liberal attitudes on racial and cultural issues than in the past. This shift has been very dramatic since 2012. According to the ANES data, the proportion of white Democrats scoring either low or very low on the racial resentment scale increased from 36% in 2012 to 57% in 2016 to 76% in 2020. Among white Democrats without a college degree, the proportion scoring either low or very low on the racial resentment scale increased from 26% in 2012 to 44% in 2016 to 63% in 2020. Among white Democrats with college degrees, the proportion scoring either low or very low on the racial resentment scale increased from 56% in 2012 to 75% in 2016 to 86% in 2020.
Note: Loyalty based on those voting for major party candidates
Source: American National Election Studies Cumulative File
This dramatic change in the racial attitudes of white Democrats has had important electoral consequences because racial attitudes are strongly related to party loyalty in voting. White Democrats with liberal racial attitudes are much more likely to support Democratic candidates than white Democrats with conservative racial attitudes. The decline in the proportion of white Democrats with conservative racial attitudes has contributed to a substantial increase in party loyalty among members of this group. In 2020, according to the ANES data, 96% of white Democrats reported voting for the Democratic nominee, Joe Biden. This was the highest level of loyalty among white Democrats in any presidential election in the entire ANES series, going back to 1952. As recently as 1988, only 80% of white Democrats reported voting for the Democratic nominee, Michael Dukakis.
The sharp increase in party loyalty among white Democrats has largely offset the impact of declining Democratic identification among whites since the 1980s. The Democratic base today is somewhat smaller than it was 40 years ago but it is much more loyal in its voting behavior, as shown in Figure 7. That is a major reason why Democratic candidates have won the popular vote in 7 of the last 8 presidential elections.
— The calendar year before the presidential primary voting begins is often defined by winnowing, as contenders emerge and then fade.
— But Donald Trump and Ron DeSantis are taking up so much oxygen that we may already have the top contenders, with everyone else who runs essentially an afterthought.
— DeSantis is polling well for a non-candidate, but we need to see how he actually performs before assuming that his support is solid.
— If another candidate supplants DeSantis (or Trump), or at least vaults into their stratosphere, don’t necessarily assume it will be someone who is currently well-known now or has a lot of formal political experience.
It feels late — and also early — in the race for the Republican presidential nomination.
It may be late because despite the fact that we are still nearly a year away from the actual voting, the top 2 contenders seem to be so clear. The winnowing process that so often defines the year in advance of the primary voting may have effectively already happened – it’s just that the winnowed candidates, some of whom aren’t even candidates yet, don’t know that their fate is already sealed.
And yet it may be very early because the person who seems like Donald Trump’s chief rival, Gov. Ron DeSantis (R-FL), is both in an enviable, impressive position but also is unproven as a national candidate, which means he is not guaranteed to have staying power.
Donald Trump already served a single term as president, lost reelection, and is seeking to be renominated, putting him in the position of being a quasi-incumbent. In national polls of the GOP presidential primary that ask about multiple candidates, Trump typically registers in the 40s, sometimes getting into the 50s. That is a strong starting point, but he is not the undisputed leader of the party, like he was in 2020 when he was an incumbent running for reelection. He also may be coasting to some degree on name ID. Still, Republicans have long struggled to actually land punches on him — to the extent they have even tried.
Meanwhile, DeSantis remains an undeclared candidate, but he is acting very much like an actual candidate. He just released a book, and he embarked on a national tour recently, including speaking at one of the great Republican forums in the country, the Reagan Presidential Library in Simi Valley, California. While he generally polls considerably lower than Trump in national polls, DeSantis still registers a level of support ranging from the mid-20s to the low-to-mid 30s. That is impressive for someone who has never before run for president or been part of a presidential ticket, as Nate Cohn recently documented in the New York Times.
In the RealClearPolitics average of national polls, Trump and DeSantis together get about 75% of the total support. That’s a little bit more than what national polls showed in the early days of the 2008 Democratic presidential primary, which turned into a 2-way contest between Hillary Clinton and Barack Obama: At this time in 2007, Obama and Clinton generally shared about 60%-65% of the support in national polls. Maybe this race will just end up looking a lot like that 2008 Democratic contest — one in which many candidates competed, but only 2, Clinton and Obama, ever really showed much ability to actually win the nomination.
But this race is not guaranteed to follow the Clinton-Obama model. The composition of the debate stage — or stages, depending on the number of candidates — at the first Republican presidential primary debate in August remains a mystery. Political scientist Seth Masket has identified 14 potential Republican candidates, but only 5 of them have announced bids — and only 2 are people we would consider prominent national politicians. There is Trump, of course, as well as former ambassador to the United Nations Nikki Haley. Beyond them, there is businessman Perry Johnson, who was last seen failing to secure a place on the Michigan gubernatorial ballot; Vivek Ramaswamy, an entrepreneur and author; and Corey Stapleton, the former Montana secretary of state who has previously lost several primaries for higher office. Meanwhile, a couple of potential contenders have said they will not run: Sen. Ted Cruz (R-TX) and former Gov. Larry Hogan (R-MD).
That still leaves several other possible candidates who are technically undecided but have been behaving as though they might become candidates. DeSantis obviously leads that list, but we would also add former Vice President Mike Pence, Sen. Tim Scott (R-SC), and former Secretary of State Mike Pompeo, among others.
Whether those candidates can get any traction depends very much on the first of 5 questions and observations we have about the GOP field.
As mentioned above, DeSantis is in an unusually strong position for a newcomer to presidential politics. In addition to garnering a quarter or more of GOP support in national polls, DeSantis has arguably been even more competitive with Trump in state-level polls. He even sometimes leads Trump in polls of key states that ask about multiple candidates, as opposed to just a hypothetical head-to-head with Trump (where DeSantis often fares better). DeSantis has led Trump in recent multi-candidate polls of likely or registered voters released since Feb. 1 in California, Pennsylvania, and Virginia, while Trump has led DeSantis in Arizona, Kansas, Maryland, Missouri, New Hampshire, and South Carolina (we used the latest polls list from FiveThirtyEight to track these surveys). So the individual polls vary, but both Trump and DeSantis backers can point to good results for their candidate in individual states.
Say what you want about Trump, and we have said plenty, but he is basically a proven commodity at this point. He has won, he has lost, he has been at the center of politics for almost 8 years now and has been a well-known figure in American life for much longer than that. He is well-defined. He continues to face several ongoing legal questions — Insider laid all of them out here. These cases are obviously worth monitoring but we’re not going to assume in advance that any of them will ensnare him or cause his campaign serious damage. That is not to say that we should assume Trump’s level of support will be static in the primary — he may rise or fall depending on his own performance or the performance of his rivals — but at this point we think it’s less likely that he experiences huge gyrations in his level of support.
DeSantis is different — or at least might be different. We have no idea how he will perform as an actual presidential candidate, and the public’s perception of him is less solid. Maybe he enters the race, is well-received, and emerges more clearly as Trump’s chief rival, perhaps even surpassing the former president. Or maybe he flames out, as other seemingly formidable but ultimately unsuccessful candidates before him, like then-Texas Gov. Rick Perry after he was a relatively late entrant to the 2012 GOP presidential race. Perry skyrocketed to the top of the GOP field but then fell off quickly as he performed poorly as a candidate.
Current polling numbers are not going to help us project how DeSantis will actually perform. We don’t know what to expect — all we know is that we don’t know.
How well DeSantis campaigns is really the key to the question posed at the start of the article, whether it is late or early in the primary process. If DeSantis is as strong as he now appears, there just is not much oxygen for anyone else besides Trump.
The astute political journalist Ron Brownstein long ago coined the term “wine track” versus “beer track” to analyze presidential primary coalitions. He recently discussed the history of the dynamic and how it has often applied to Democratic primaries, but now is very salient on the GOP side (we recommend his CNN piece for a fuller exploration of this dynamic).
Basically, on the GOP side, the “wine track” means having a 4-year college degree, while “beer track” means not having a 4-year degree. Trump won in 2016 by not only doing better among beer track voters than wine track voters, Brownstein writes, but also because wine track voters were more divided in 2016 among different candidates than beer track voters were.
This blue collar/white collar divide is evident in polling. For instance, a recent national survey from the GOP firm Echelon Insights showed Trump leading DeSantis 46%-31%, with Pence at 9% and Haley at 6%. Trump dominated among those who do not have a bachelor’s degree, 54%-27%, but DeSantis led Trump, narrowly, 36%-33% among those who had a bachelor’s degree or more. The Pence/Haley combo also got more support among college graduates — 22% combined compared to 11% among the non-college group. This poll — and others show similar findings — illustrates the basic dynamic: Trump is stronger with the non-college group than the college group, and the college group is more divided than the non-college group.
We can see this at the state level, too. The GOP firm Differentiators polled likely Virginia GOP primary voters in late February, finding DeSantis up 37%-34% in a multi-candidate field. But the regional splits were telling: DeSantis led Trump by 14 points in the highly-educated Washington, DC suburbs/Northern Virginia region, while Trump led DeSantis by 17 points in rural, western Virginia, where 4-year college attainment is not nearly as high. This reflects the pattern we saw in Virginia in the 2016 primary: Trump beat the second-place finisher, Rubio, by about 3 points statewide. Rubio won the core DC suburban counties, as well as Richmond and its most vote-rich suburban counties. Trump won almost everywhere else, including landslide margins in many western Virginia locales.
So one can see the outlines of a dynamic similar to 2016, and how in order to defeat Trump, a single candidate likely needs to consolidate the “wine track” (college-educated) vote at least as well as Trump consolidates the “beer track” (non-college) vote. That candidate very well may be DeSantis but, again, we’ll just have to wait and see.
While individual states varied, exit polls in many GOP contests in 2016 pointed to an overall electorate that was basically split 50-50 between those who held 4-year college degrees and those who did not. Non-college voters more clearly outnumber college-educated voters in the broader electorate, but remember that primaries (even very competitive ones) are going to have lower turnout than presidential general elections, and that people with degrees are likelier to vote than those who do not have degrees. That said, it’s also possible that exit polls, which have a reputation for overstating the education level of the electorate, may have suggested that the 2016 electorate had a bit higher of an education level than it did in reality.
Trying to determine the education level of the likely GOP electorate is going to be a challenging but important task for pollsters in the leadup to the primary season, because there is likely to be a difference in the preferences of college graduates versus non-graduates, with Trump drawing more support from voters who do not have a 4-year degree and his main rival, or rivals, doing better with those who do have a 4-year degree.
Though the 1988 presidential election is most remembered for its largely negative general election campaign between then-Vice President George H. W. Bush (R) and Gov. Michael Dukakis (D-MA), it was also the first of 3 attempts that Joe Biden made at the White House. While Biden ended up dropping out before the first primary votes were cast, there were a handful of other Democrats in the running — the press sometimes referred to the group of hopefuls as the “Seven Dwarfs.”
Some primaries that have taken place more recently — namely the 2016 GOP and 2020 Democratic contests — have felt more like watching 101 Dalmatians, to use another Disney reference. In the latter primary, roughly 2 dozen candidates ended up participating in at least one debate.
The ballooning number of candidates in recent cycles has been driven, at least to some degree, by the entrance of lesser-known, electorally inexperienced candidates. Could one or more of them break through, at least for a time, in 2023 or 2024?
Trump is the ultimate example of what has become a familiar dynamic on the Republican side: Someone with no previous elected experience achieving prominence within the party. But there were other examples in recent GOP presidential primaries. In late October/early November in 2011, the late businessman Herman Cain took a lead in national GOP primary polling. Four years later at almost the exact same time in the GOP primary, Trump very briefly relinquished the national polling lead to Ben Carson, a prominent former neurosurgeon. Neither first-time candidate lasted at the top for very long, and both ended up as afterthoughts when the voting actually began, but we do wonder if we may see similarly shocking rises this time.
It may be that the dominance of Trump and DeSantis prevents anyone else from breaking through. But if someone does, it may not necessarily be the most obvious, or most experienced, alternatives who do.
One thing to watch out for, especially as candidates enter the race, will be the strength of candidates in their own home states. Throughout the past several primary cycles, some candidates have been able to perform well in their home state, or region, despite having limited support elsewhere. For someone trying to actually win a nomination, doing well in one’s home state seems like a prerequisite.
One of the more recent examples, on the Republican side, came in 2016: Kasich carried his home state by 11 points over the then-ascendent Trump. Though it earned the governor a less-than flattering nickname — after that mid-March contest, Trump derided him as “1 for 38 Kasich” — it did give the Kasich campaign some credibility, in that he became 1 of only 3 candidates in a wide field to actually beat Trump in a nominating contest. The Ohio primary that year also previewed some of the dynamics that took hold in the general election: Kasich took majorities in several metro counties, but Trump won almost every county in the state’s post-industrial Appalachian east. Still, on that same primary day, Trump easily won Florida over home-state Sen. Rubio, which pushed Rubio out of the race.
In past cycles, the “favorite son” effect has made some contests that occur earlier on the calendar less predictive. In 1992, the Iowa caucus, which kickstarted the campaigns of future presidents Jimmy Carter in 1976 and Barack Obama in 2008, got little attention. That year, its home state senator, prairie populist Tom Harkin, was running. As other Democrats eschewed Iowa, and Harkin won with close to 80% of the vote. But in the next contest, the New Hampshire primary, Harkin’s fourth place showing cast doubt on his national viability. Bill Clinton, a southerner who finished second to former Sen. Paul Tsongas of neighboring Massachusetts, meanwhile spun his relatively strong showing by famously declaring himself the “comeback kid.”
South Carolina — which has, all things considered, been one of the more predictive early states — has also occasionally been impacted by home region candidates. In the 2004 Democratic contest, Sen. John Edwards, from next door North Carolina, won the contest handily but struggled in subsequent primaries, although he remained competitive in some other southern contests — most notably, he won his home state’s caucus despite having dropped out. Edwards, of course, eventually found his way onto the national ticket that year. In early 2012, former House Speaker Newt Gingrich (R) seemed to have some momentum but similarly stalled out — he carried South Carolina and then his neighboring home state, Georgia, on Super Tuesday. Former Sen. Rick Santorum (R-PA) then emerged as the most viable conservative alternative to eventual nominee Mitt Romney (R-MA). Had Gingrich not been in the running, would things have been different if his voters consolidated behind Santorum?
The 2024 GOP field might include at least 2 South Carolinians, each of whom could conceivably have some similar home-state appeal: former Gov. Haley entered the race last month, while Sen. Scott has been sounding like a candidate in recent months. Still, with presidential politics becoming more nationalized, the home state bonus candidates receive has been lessening. In the 3 most recent South Carolina polls (all from conservative sources), Trump and DeSantis were first and second in the state, with Haley and Scott behind them.
In our home state, Gov. Glenn Youngkin (R-VA) has been widely rumored to be an eventual national candidate. While he gets a near-unanimous (87%) positive favorability from Republicans in the commonwealth, the aforementioned Virginia poll from the Differentiators found him taking just 6% against a field of potential candidates (another February poll from Roanoke College found Youngkin also at 6% in Virginia). Gov. Chris Sununu (R-NH), a Trump critic and potential candidate, polled at just 7% in a recent Emerson College survey of his home state. To the extent that any of these announced or potential candidates break through, one would think they would first have to show significant strength at home.
Trump is effectively in an unprecedented position in the modern history of presidential nominations, a time period that covers basically the last half-century, when presidential nominations became much more about winning primaries and caucuses as opposed to using backdoor wheeling and dealing to win the nomination at the convention. In that timeframe, Gerald Ford, Jimmy Carter, George H.W. Bush, and Trump lost reelection bids. None of the prior trio later sought a return to the presidency, although Ronald Reagan and Ford did discuss the latter joining his ticket as the vice presidential nominee in 1980. So what Trump is attempting is unfamiliar, as is so much else about his political persona.
In a webcast held shortly after the 2020 election, longtime Almanac of American Politics co-author Michael Barone looked to history when evaluating the GOP’s future. One of Barone’s conclusions was that past Republican presidents were typically popular with their party while in office, but had difficulty winning over their fellow partisans when trying to stage a comeback.
The best example of that phenomenon was from over a century ago (which, again, speaks to how rarely former presidents seek a return to the White House). After leaving office, Teddy Roosevelt remained a popular figure, and actually finished first in most states that held Republican primaries in 1912 — but he could not convince Republican convention delegates to dump his successor, William Howard Taft. Roosevelt famously ran as an independent “Bull Moose” candidate in the general election, which handed the presidency to Democrats. Pundits have discussed the prospect of a third-third party run by a snubbed Trump since at least 2016, but looking to 2024, Trump may face some logistical hurdles if he opts to go that route.
While history has not been a perfect guide in today’s politics — a recent example being Democrats overperformance in last year’s midterms — Trump’s standing with Republicans is not as strong as it once was — a sign that the party may be ready to move on.
Trump is probably the favorite to start, if only because — as mentioned above — we need to see how DeSantis performs. If the Florida governor does enter, and does maintain or grow his level of support after becoming a candidate, then the battle for the nomination becomes more of a coin flip.
Enlarge (credit: Getty Images)
The Biden administration on Thursday pushed for new mandatory regulations and liabilities to be imposed on software makers and service providers in an attempt to shift the burden of defending US cyberspace away from small organizations and individuals.
"The most capable and best-positioned actors in cyberspace must be better stewards of the digital ecosystem,” administration officials wrote in a highly anticipated updated National Cybersecurity Strategy document. “Today, end users bear too great a burden for mitigating cyber risks. Individuals, small businesses, state and local governments, and infrastructure operators have limited resources and competing priorities, yet these actors’ choices can have a significant impact on our national cybersecurity."
The 39-page document cited recent ransomware attacks that have disrupted hospitals, schools, government services, pipeline operations, and other critical infrastructure and essential services. One of the most visible such attacks occurred in 2021 with a ransomware attack on the Colonial Pipeline, which delivers gasoline and jet fuel to much of the Southeastern US. The attack shut down the vast pipeline for several days, prompting fuel shortages in some states.
Qongress troll Marjorie Taylor Greene finally came around, stepping across the aisle to boast about President Biden's impressive record on fentanyl seizures. The stable genius even pointed out how much safer we are with Biden than we ever were Donald Trump. — Read the rest
— If no candidate receives a majority of Electoral College votes, the U.S. House of Representatives elected in the 2024 election would decide the presidency.
— Republicans are very likely to continue to control enough House delegations to select the GOP nominee as the winner, meaning that 269 is effectively the winning Electoral College number for Republicans, while it’s 270 for Democrats.
— Republicans currently control 26 of the 50 House delegations, the bare majority to win in the House if the Electoral College does not produce a majority winner.
Next year, 2024, coincides with a pair of bicentennial anniversaries in American presidential election history.
The presidential election of 1824 was the first one in which there is a tabulation of the actual popular vote for president, albeit not from every state. A majority of states in the Union at the time had adopted a popular vote for presidential electors; previously, presidential electors had generally been chosen by state legislatures. Thus, one can describe 2024 as representing the 200th anniversary of a popular vote for president, even if the totals represented only 18 of the 24 states voting at the time. (This history is from What Hath God Wrought: The Transformation of America, 1815-1848 by Daniel Walker Howe).
The 4-way presidential race failed to produce a majority winner in the Electoral College: Andrew Jackson finished first, with 41% of the popular vote and 38% of the electoral votes, short of the majority required for election. The election went to the House of Representatives, which brings us to the second bicentennial anniversary in 2024: 1824 was the most recent election in which the House decided the presidential winner. The 12th Amendment stipulates that in the event no one wins a majority of the Electoral College votes, the House chooses among the top 3 finishers in the Electoral College, with each state’s delegation getting a single vote. The House ended up backing the second-place finisher, John Quincy Adams. Jackson would get his revenge in a landslide victory 4 years later.
The dueling anniversaries illustrate the conflicting realities at the heart of the American presidential election system. On one hand, the 1824 election represents an important step in the evolution of the mass electorate’s role in presidential elections, with the franchise slowly being expanded to women, Black Americans, 18-20 year olds, and others over the course of the past 2 centuries. The expansion of the franchise has at its heart a very basic assumption — the voters should pick the president.
On the other hand, the dusty, old system used in 1824 to resolve an inconclusive election endures, lying in wait to befuddle most Americans (and enrage many of them) if it is ever needed. It is reminiscent of the Electoral College itself — an ancient foundation upon which we have constructed our modern representative democracy. Like the Electoral College, the House tiebreaking procedure was created at a time before rank-and-file voters were truly involved in selecting the president. So if the people (the voters) don’t produce a clear verdict, they effectively forfeit the choice to an elected representative body, albeit divided in such a way (into 50 state-level subgroups) that might not make it representative of the full membership of the whole House. This is not neatly compatible with majoritarian ideals — but, then again, neither is the Electoral College or the U.S. Senate. Would we design a system like this today? The answer is obvious, but it also just doesn’t matter in the context of the upcoming election, as the system is not going to change. So we need to understand it in order to be ready for all possible outcomes.
The House tiebreaking procedure — unlike the Electoral College, which is endlessly debated and analyzed — is not a prominent feature of election analysis and commentary, probably because it has never been used in anyone’s lifetime and because the odds of it being used are so low. But as we showed in yesterday’s Crystal Ball, a tie came close to happening in 2020, and there are plausible scenarios under which it could happen in 2024.
If there is a tie, Republicans continue to have an advantage in the House tiebreaking procedure, and they are very likely to retain it following the 2024 election, regardless of which party wins the overall House majority.
That’s because in the House tiebreaking vote, each of the 50 states gets a single vote, and a majority of the votes (26) are required to select a president. Presumably, members of the party that hold a majority of seats in a given delegation would cast their vote for their party’s presidential candidate. Evenly-divided states might end up unable to cast a vote. The new House — meaning the one elected in 2024, not the current one — would break the tie. The Senate, meanwhile, would select the vice president. That is a more straightforward process, as each of the 100 senators gets a single vote.
Map 1 shows the control of the individual House delegations by party.
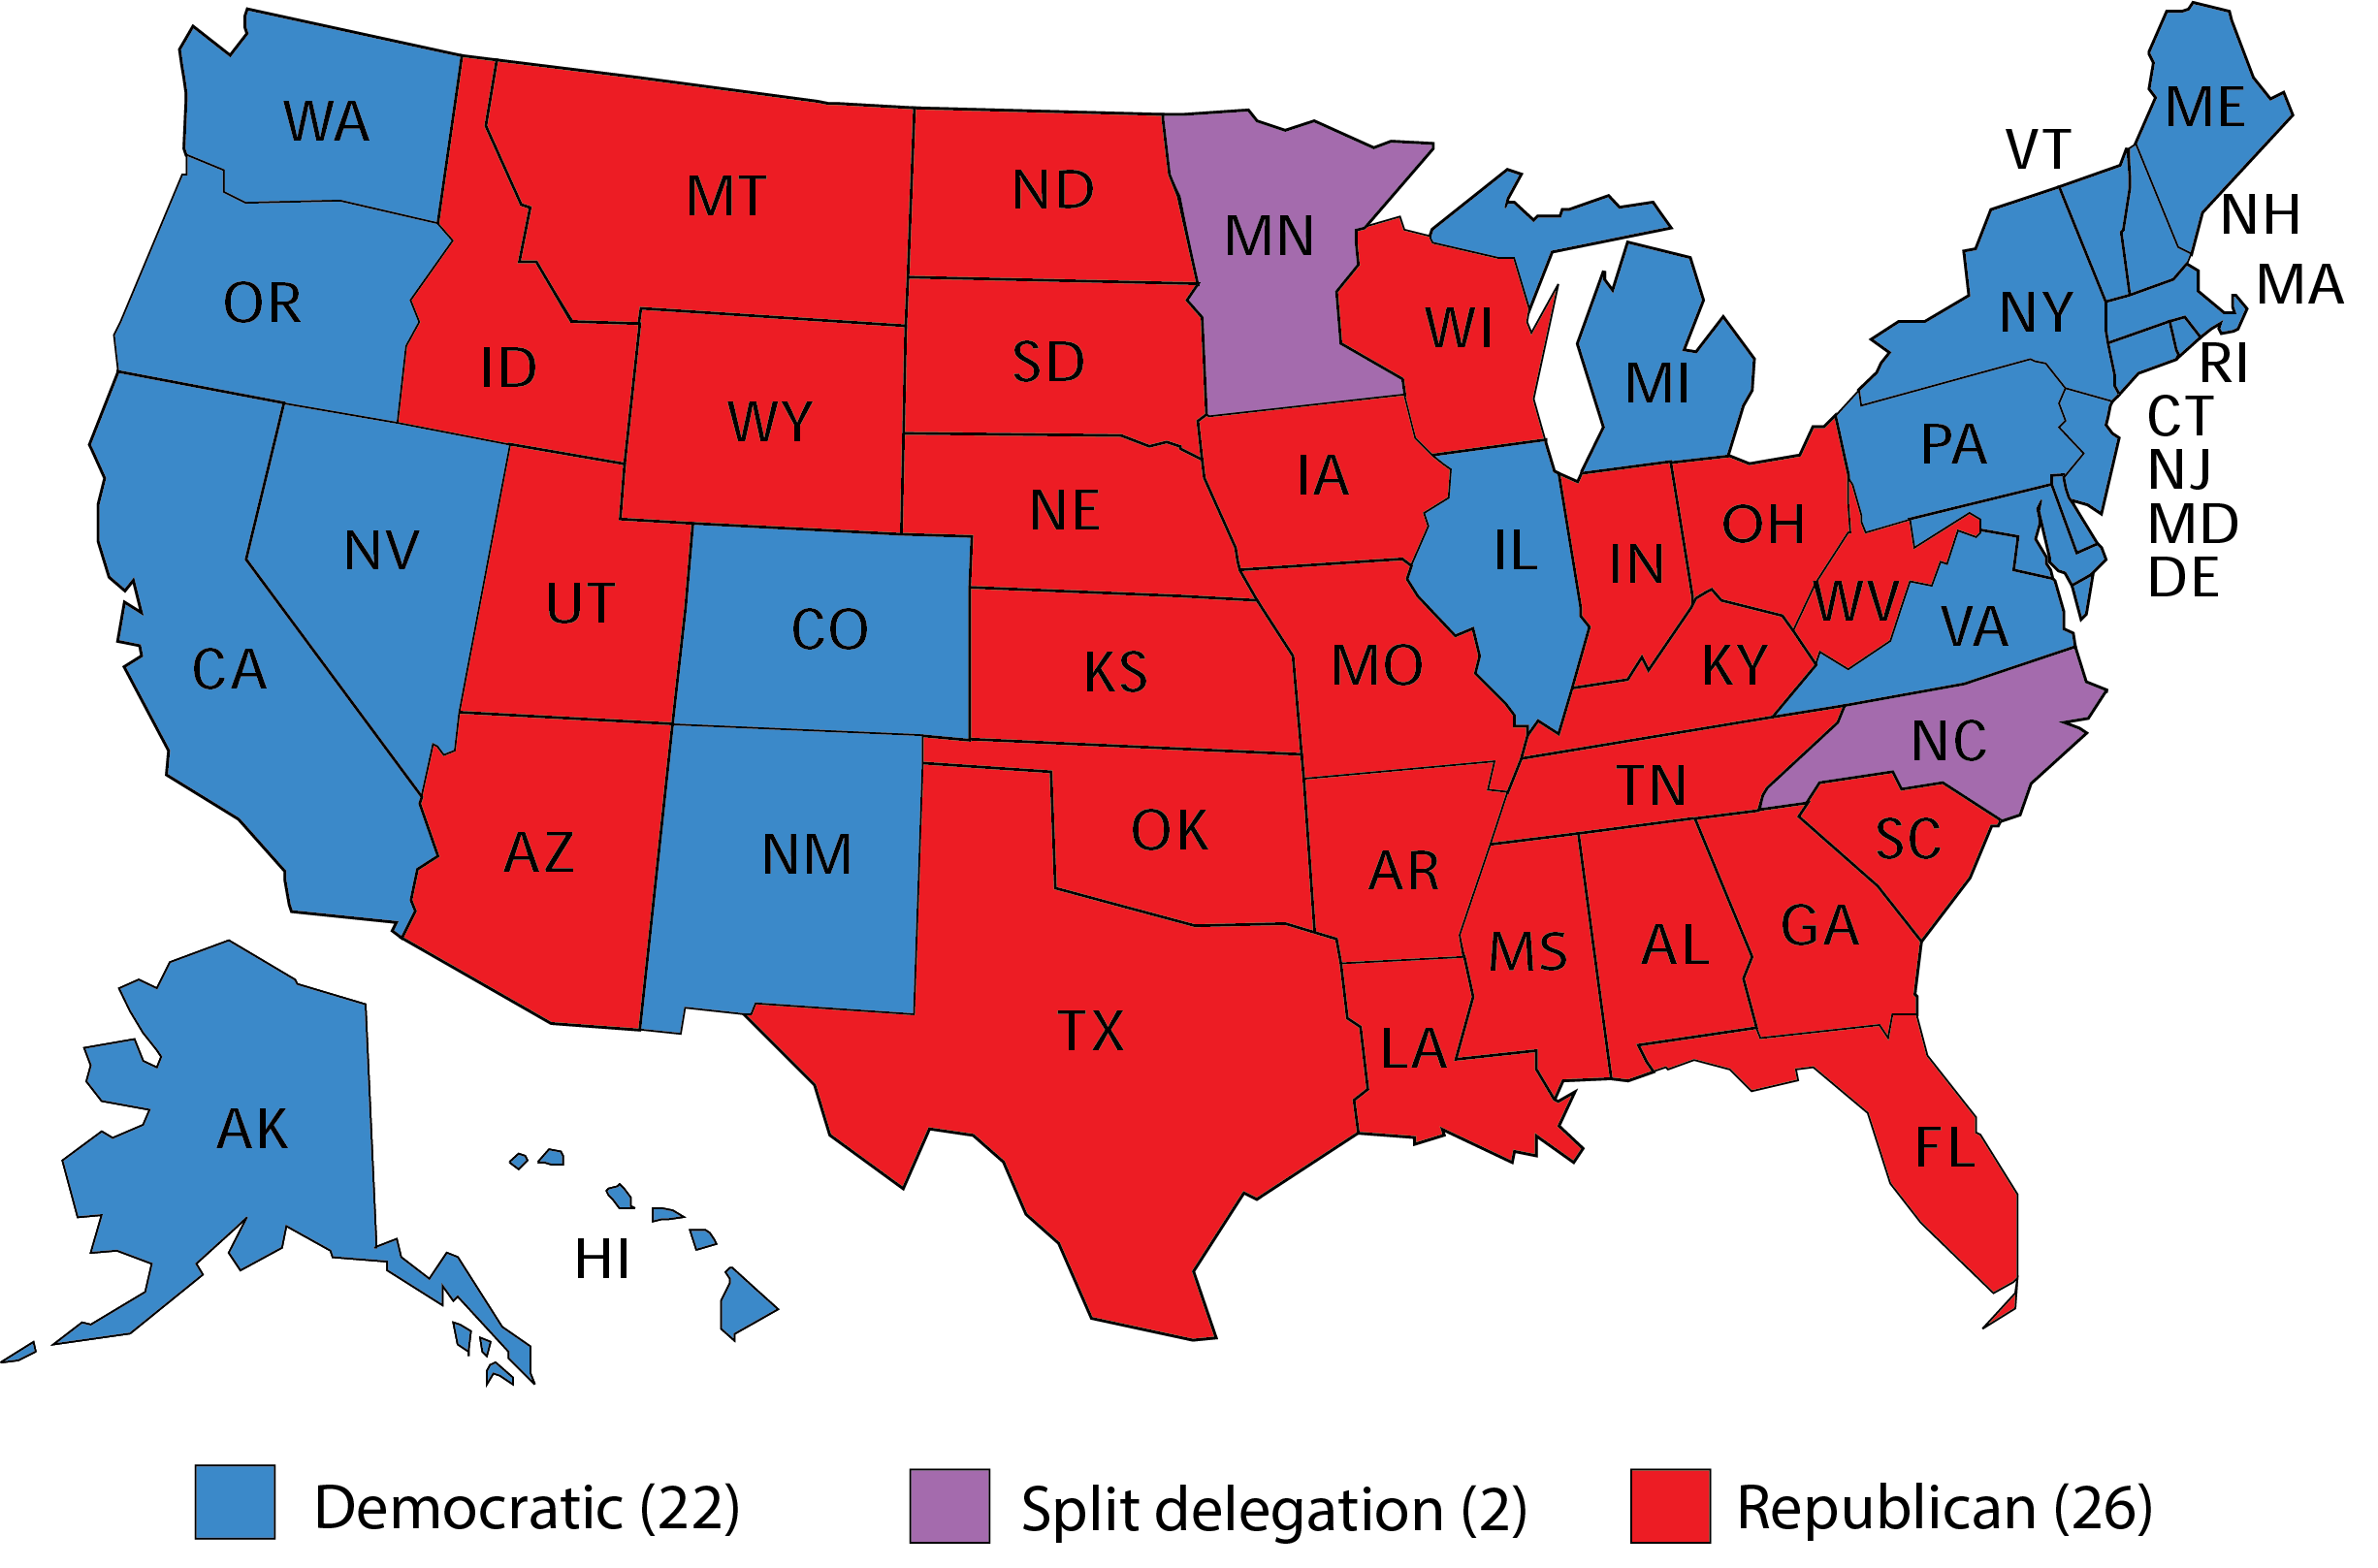
Republicans currently control 26 of the 50 House delegations, the bare minimum needed to elect the president in a House vote. Democrats control 22, and a pair of states — Minnesota and North Carolina — are split. This is almost the exact same division as there was the last time we wrote about this, in advance of the 2020 election, when Republicans held a 26-23-1 advantage (a handful of states have changed hands either way since then). Back when we last looked, in September 2020, Democrats held a 232-198 advantage in the House, with 4 vacancies at that time and with now-former Rep. Justin Amash of Michigan serving as an independent after leaving the GOP. Now, Republicans will have a 222-213 majority once Rep.-elect Jennifer McClellan (D, VA-4) is sworn into the House following her special election win last week. Democrats held the majority back in 2020, but now Republicans do.
We recently released our initial House ratings for 2024. Those ratings help inform our state-by-state assessments of the delegations. Let’s start with the delegations we consider to be effectively Safe Republican, then those that are Safe Democratic, and finally those where there is at least a little bit of a question about which side will control the delegation following next year’s elections.
First of all, 22 states have House delegations we consider Safe Republican in 2024: Alabama, Arkansas, Florida, Georgia, Idaho, Indiana, Kansas, Kentucky, Louisiana, Mississippi, Missouri, Nebraska, North Dakota, Ohio, Oklahoma, South Carolina, South Dakota, Tennessee, Texas, Utah, West Virginia, and Wyoming.
Meanwhile, Democrats have just 13 Safe delegations of their own: California, Connecticut, Delaware, Hawaii, Illinois, Maryland, Massachusetts, New Jersey, New Mexico, New York, Rhode Island, Vermont, and Washington.
That leaves 15 states where there is at least some question about which party will control the delegation following 2024. We’ll go through them in alphabetical order:
Alaska: Rep. Mary Peltola (D, AK-AL) is the single member of this House delegation. In addition to facing what will likely be a competitive reelection challenge, Peltola also would face pressure to cast her vote for the presidential winner in her state, assuredly a Republican in a situation where a tie is possible (we could imagine a Democrat carrying Alaska for president, but only as part of a national landslide). Leans Democratic
Arizona: Republicans flipped this delegation from 5-4 Democratic to 6-3 Republican last year. However, 2 of the GOP seats are very marginal, so Democrats could win the delegation back as soon as next year. Leans Republican
Colorado: Democrats have a 5-3 edge, but Rep. Yadira Caraveo (D, CO-8) only very narrowly won a new swing seat, and Rep. Lauren Boebert (R, CO-3) also came very close to losing a Republican-leaning seat. If things broke right for Republicans, they could get to a 4-4 tie. Leans Democratic
Iowa: Republicans have a 4-0 edge, which they completed last year with Rep. Zach Nunn’s (R, IA-3) very close win over former Rep. Cindy Axne (D) in the marginal Des Moines-based IA-3. Democrats would have to win that seat back and flip 1 of 2 competitive but Republican-leaning eastern districts to get to a tie (we rate both seats Likely Republican). Iowa may not be quite Safe Republican, but it is close. Likely Republican
Maine: Republicans could forge a tie here if they knocked off Rep. Jared Golden (D, ME-2), who holds a Trump-won seat. Leans Democratic
Michigan: Democrats hold a narrow 7-6 statewide lead, but they are defending the open MI-7, which was very narrowly decided for president in 2024. Reps. Dan Kildee (D, MI-8) and John James (R, MI-10) also hold marginal districts. Toss-up
Minnesota: The delegation is split 4-4, and the only truly competitive seat is held by Rep. Angie Craig (D, MN-2), but it is Biden +7 and Craig won a solid, 5-point victory last year. Leans Split
Montana: Republicans should hold on to their 2-0 edge here, but the seat held by Rep. Ryan Zinke (R, MT-1) is somewhat competitive (Trump +7) and Zinke won by just 3 points last year in an open-seat race. He may or may not run for Senate. Leans Republican
Nevada: The Democrats’ gerrymander helped preserve the party’s 3-1 edge here, and they remain favored in all 3 seats to start this cycle. Likely Democratic
New Hampshire: Republicans hypothetically could compete for either of the state’s seats, but both are a bit bluer than the nation as a whole. Likely Democratic
North Carolina: The state is split 7-7 right now, but it appears to be only a matter of time before Republicans redraw the map, which was imposed last cycle by a Democratic-majority state Supreme Court that has now flipped to Republican control. Assuming the Republicans end up being able to gerrymander North Carolina, they should easily win a majority of the state’s seats next year. Likely Republican
Oregon: Democrats have a 4-2 statewide edge, and the most competitive district is OR-5, which Rep. Lori Chavez-DeRemer (R) flipped last year. Likely Democratic
Pennsylvania: Democrats hold a slim 9-8 edge here, but Reps. Matt Cartwright (D, PA-8) and Susan Wild (D, PA-7) are defending Toss-up seats. Toss-up
Virginia: Rep. Jen Kiggans (R, VA-2) flipped the state’s most marginal district to cut the Democratic edge to 6-5, but Republicans will have to unseat Rep. Abigail Spanberger (D, VA-7) in a Biden +7 district to flip the delegation. Likely Democratic
Wisconsin: Republicans hold what on the current map is a fairly solid 6-2 statewide lead after flipping WI-3 last cycle, but if a Democratic-aligned justice wins next month’s state Supreme Court election, Democratic-aligned justices will control the court 4-3. That could open the door to litigation that would force a new congressional district map, perhaps splitting the Milwaukee and Madison areas and getting the delegation to 4-4. There are a lot of what ifs here, but the situation merits watching. Likely Republican, for now
So Republicans start with 22 Safe delegations. Iowa and North Carolina are likely to be delegations 23 and 24, and we favor Republicans to hold the majorities in Arizona and Montana. That’s 26 right there, and it doesn’t even include Wisconsin because of the redistricting situation. It also wouldn’t take much for Republicans to flip the Toss-ups, Michigan and Pennsylvania, particularly in a world where an Electoral College split is happening, which would suggest a close and competitive presidential election.
Meanwhile, it’s exceedingly difficult to imagine Democrats getting to a bare majority themselves, 26, in the midst of an otherwise competitive national election. There are circumstances where they could deny Republicans a majority by winning or forcing ties in almost all of the competitive states noted above.
How a deadlocked House would resolve a presidential election if neither side had a majority of delegations is anyone’s guess. Perhaps it wouldn’t. It is also unclear how a majority party that nonetheless did not control a majority of delegations would act from a procedural standpoint. If the Senate could produce a vice president (that chamber is 51-49 Democratic but is very gettable for Republicans next year), that vice president would serve as president if the House does not produce a president.
The bottom line here is that Republicans appear likely to maintain control over the presidential tiebreaking process in the House, meaning that their Electoral College magic number is effectively 269, not 270.
One other alternative that could throw the election to the House is a scenario in which a third candidate wins enough electoral votes to prevent either of the major party nominees from getting to 270. This would make the situation more comparable to 1824, when there were multiple, credible candidates who got electoral votes, making it difficult for anyone to get a majority.
While there have been protest votes cast by faithless electors in some instances over the past few decades, the last time a third party candidate actually won electoral votes in his own right was George Wallace, the Dixiecrat segregationist who way back in 1968 carried 5 Southern states and 46 electoral votes. Richard Nixon still won the Electoral College, but enough states were close that had things gone a little differently, the election could have gone to the House (which Wallace wanted as a way to dictate terms to the eventual winning candidate). That led to a serious effort to amend the Constitution to eliminate the Electoral College. President Nixon supported a constitutional amendment that easily passed the House, but it died in the Senate (Washington Post history blogger Gillian Brockell wrote about this after the 2020 election).
What third party candidate could win electoral votes in 2024? While the likeliest answer is that no one will, Donald Trump is the most plausible candidate. Republicans have long feared Trump running as a third party candidate, and he could potentially do so if he loses the 2024 Republican nomination (we’ll believe it when we see it, but one cannot rule anything out with Trump). A recent poll by Republican pollster Whit Ayres for the Bulwark found that 28% of Republican primary voters would back Trump in a general election even if he ran as an independent — a group the publication’s Sarah Longwell called the “Always Trumpers.” Again, this is all hypothetical, but if Trump ran as a non-major party candidate, got on ballots, and actually attracted and maintained this kind of support, he could potentially win some states — West Virginia, where he turned in a blockbuster performance for a GOP presidential nominee, comes to mind.
In all likelihood, this kind of GOP split — where Trump was strong enough to be winning states despite not being the GOP nominee — would swing the election to the Democratic nominee as opposed to forcing the election to the House (it could be a version of the 1912 election, when a GOP split allowed Woodrow Wilson to win the presidency). Although if this 3-way 2024 election did go to the House, imagine the political theater of House Republicans having to choose between their party’s nominee and Trump.
OK, we’ll admit, our imagination might be getting a bit out of hand here. Meanwhile, we very much hope that the 200-year streak of the House not having to pick a presidential winner goes on for many years longer. Because if that streak stops, Americans are going to be reminded just how arcane our nation’s electoral rules can be.
![]()
— One of the big stories of American politics over the past half-century has been a growing ideological divide between Democrats and Republicans.
— This has also led to more ideological cohesion within parties, including a dramatic increase among Democrats between 2012 and 2020. Democrats are now as ideologically cohesive as Republicans, which is a big change from a decade ago, when Republicans were significantly more cohesive than Democrats.
— While white Democrats have moved more to the left than nonwhite Democrats have on some issues, both groups have become more liberal since 2012.
Growing partisan-ideological congruence has been one of the most important trends affecting American politics over the past several decades. The ideological divide between Democrats and Republicans has increased dramatically since the 1970s as Republicans have grown increasingly conservative and Democrats have grown increasingly liberal. This increase in partisan-ideological congruence has affected rank-and-file voters as well as party elites and activists.
In this article, I use data from American National Election Studies surveys to examine trends in partisan-ideological congruence among Democratic and Republican voters since 2012. To measure partisan-ideological congruence, I examine trends in ideological identification and policy preferences among Democrats and Republicans. In addition, I examine whether there is evidence of an emerging ideological divide between white and nonwhite Democratic voters. The findings indicate that from 2012 to 2020, there was a dramatic increase in liberalism among Democratic voters. This leftward shift has been somewhat greater among white Democrats than among nonwhite Democrats. However, both white and nonwhite Democrats moved to the left over that timespan. As a result, for the first time in recent history, partisan-ideological congruence is as great among Democrats as among Republicans. This trend has important implications for voting behavior.
The ideological divide between Democratic and Republican voters has been increasing since at least 1972, when the American National Election Studies first included a question measuring ideological identification. The long-term trend is displayed in Figure 1, which includes data for every presidential election between 1972 and 2020. The liberal-conservative scale ranges from 1, the most liberal score, to 7, the most conservative score.
Note: Based on average score of those answering the ideology question. Those opting out of the question are not included.
Source: American National Election Studies Cumulative File
In 1972, supporters of the two parties were separated by an average of one unit on the 1-7 scale. The mean score for Democratic voters was 3.7, just slightly to the left of center, while the mean score for Republican voters was 4.7. By 2020, the distance between supporters of the two parties had increased to an average of 2.6 units. The mean score for Democratic voters was 2.8 while the mean score for Republican voters was 5.5. These were the most extreme average scores for supporters of both parties since the ANES started asking the ideological identification question.
Beyond the long-term trends in ideological identification, the data in Figure 1 indicate that the divide between supporters of the two parties has increased considerably since 2012 and that most of this increase was due to a sharp leftward shift among Democratic voters. Between 2012 and 2020, the mean score for Democratic voters went from 3.3 to 2.9 while the mean score for Republican voters went from 5.4 to 5.5.
In order to understand the significance of this shift in ideological identification over the last 3 elections, I looked at trends in ideological congruence among Democratic and Republican voters on several policy issues in addition to ideological identification. The findings are displayed in Table 1. Ideological congruence is measured by the percentage of Democratic voters taking the liberal position and the percentage of Republican voters taking the conservative position on each issue.
Note: Congruence is defined as the percentage taking liberal position for Democrats and percentage taking conservative position for Republicans among those responding to each question. Respondents opting out of answering are not included.
Source: American National Election Studies Cumulative File
The results in Table 1 show that there was a dramatic increase in liberalism among Democratic voters over this 8-year period. The percentage of Democratic voters taking the liberal position increased by an average of more than 20 percentage points across these five questions, with the largest shift occurring on the issue of government aid to Blacks. In contrast, there was no consistent pattern of change among Republican voters over these 8 years. Republican voters became somewhat more conservative on abortion but considerably less conservative on the aid to Blacks question. A key takeaway comes in Table 1’s “Average Congruence” score — notice that it was almost identical in 2020 for Democrats and Republicans, whereas back in 2012, Republicans had a significantly higher score.
As a result of these shifts in ideological congruence between 2012 and 2020, Democratic voters are now as consistent in their liberalism as Republican voters are in their conservatism. Democrats are still somewhat less likely to identify as liberal than Republicans are to identify as conservative. On some specific policy issues, however, such as abortion and aid to Blacks, Democrats are more likely to take the liberal position than Republicans are to take the conservative position.
The sharp leftward movement among Democratic voters in recent years has led some political observers to suggest that Democrats need to be concerned about a growing racial divide in political ideology. Nonwhites make up a large share of Democratic voters — 43% in 2020 according to the ANES data — and nonwhite Democrats have traditionally been less likely than white Democrats to self-identify as liberal. A growing racial divide in ideology could lead to an erosion in support for Democratic candidates among nonwhites, who have been some of the most loyal Democratic voters.
Note: Congruence is defined as the percentage taking liberal position among those responding to each question. Respondents opting out of answering are not included.
Source: American National Election Studies Cumulative File
Table 2 displays data on trends in ideological congruence on liberal-conservative identification and 4 specific policy issues among white and nonwhite Democrats between 2012 and 2020. The evidence in this table shows that there was a large leftward shift among nonwhite as well as white Democrats over these 3 elections. Nonwhite Democrats continue to be somewhat less likely than white Democrats to self-identify as liberal and to support abortion rights. However, they are just as liberal as white Democrats on other issues such as government responsibility for jobs and living standards and aid to Blacks. The most significant trend in attitudes on these issues has been a dramatic shift to the left among white Democrats.
Democratic voters moved sharply to the left in their ideological identification and policy preferences on a range of issues between 2012 and 2020. As a result, for the first time since at least 1972, ideological congruence is now as high among Democratic voters as it is among Republican voters. This rise in ideological congruence among Democratic voters — and especially among white Democratic voters — has had important consequences for voting behavior. The data in Figure 2 show that for many years, white Democrats have lagged behind nonwhite Democrats in loyalty to Democratic presidential candidates. In 2020, however, this gap almost disappeared with white Democratic identifiers almost as loyal as nonwhite Democratic identifiers.
Source: American National Election Studies Cumulative File
The increase in loyalty among white Democratic identifiers is due largely to their increased liberalism because defections among white Democrats have been heavily concentrated among those with relatively conservative ideological orientations. This increased loyalty has also been apparent in other types of elections including those for U.S. Senate and House of Representatives. In 2022, according to data from the American National Election Studies Pilot Survey, 96% of Democratic identifiers, including leaning independents, voted for Democratic candidates for U.S. House and U.S. Senate. Growing ideological congruence among Democrats, and especially among white Democrats, suggests that these high levels of loyalty are likely to continue in 2024 and beyond.
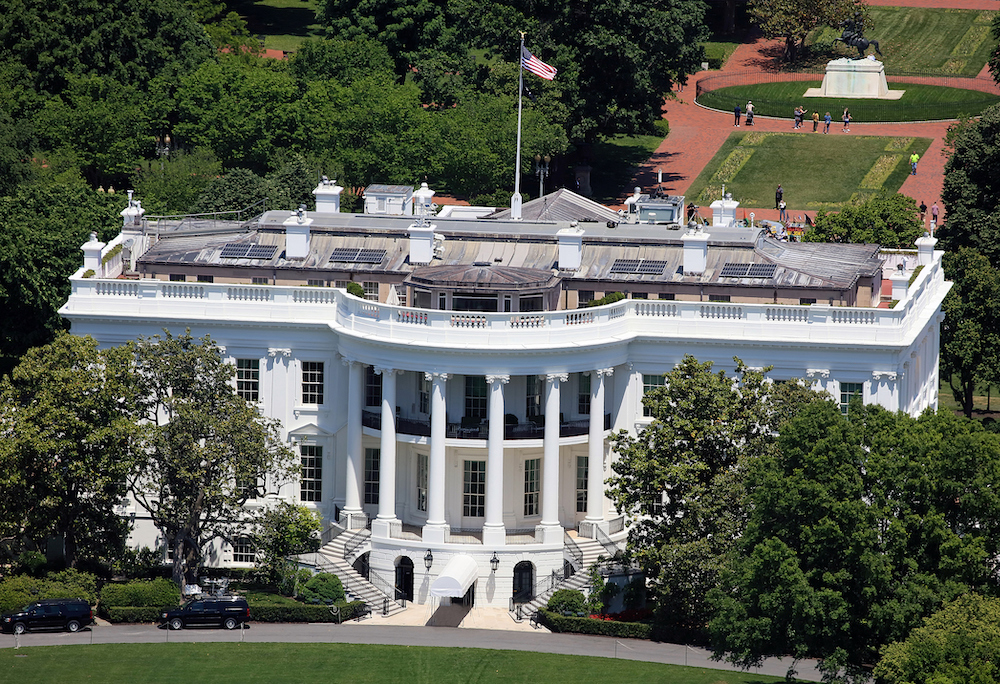